
What Should Drive Your 529 Plan Decision
Morningstar’s annual college-savings plan study highlights some of the industry’s most-pressing matters and how investors can pick the right plan.
/s3.amazonaws.com/arc-authors/morningstar/41940ba6-d0f1-493c-af96-52ad9419064e.jpg)
Today, Morningstar released its annual report on 529 college-savings plans. In the report, we explore some of the industry's most noteworthy topics, including asset-allocation glide-path design, the resources behind glide-path design, diversification, performance, fees, and industry growth. In addition, we provide a guide to help investors select 529 plans. We summarize a few of the report's key findings below.
The 529 college-savings market has nearly doubled over the past five years, reaching a record-high $227 billion in assets under management as of year-end 2015. That growing interest doesn’t surprise us; after all, the tax advantages offered by 529 investments make them one of the best vehicles to save for college. Moreover, with tuition inflation outstripping the Consumer Price Index by more than 3% annually over the past decade, affordability has increasingly become an issue. Students and college savers have become more reliant on student debt to pay the bill. Thus, investors and advisors must ensure that they are getting the most value from their college-savings plan selections.
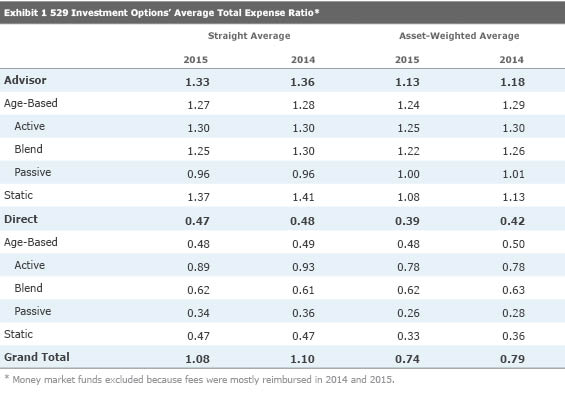
529 Plan Fees Continue to Decline The good news in that search for value is that fees continue to decline.
Investor biases toward index-based portfolios within 529 plans sold directly to investors helped drive the industry asset-weighted average expense ratio down to 0.75% as of year-end 2015 from 0.79% one year earlier. Fee reductions also helped, with direct- and advisor-sold plans both cutting expenses during the year. Advisor-sold plans seem to have responded to the ongoing shift in consumer preference by lowering total expense ratios more aggressively. As shown in Exhibit 1, the straight-average and asset-weighted expense ratios decreased more for advisor-sold plans than direct-sold plans in 2015.
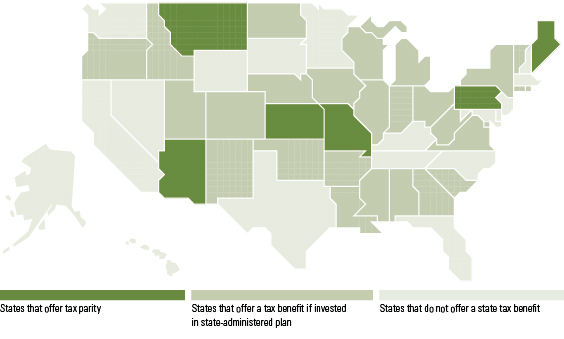
How to Choose a 529 Plan Beside fees, investors should pay close attention to any tax benefits offered by their state when picking a 529 plan. In October 2015, Morningstar published "How to Choose a 529 Plan," a guide for individual investors picking 529 investments on their own. We've expanded on that work, developing more-streamlined decision criteria for do-it-yourself investors. Exhibit 2 summarizes the decision steps for selecting an optimal direct-sold plan. The absence or presence of state tax benefits largely dictates the best plans. Investors can reference Exhibit 3 to know if their state offers a tax benefit. The full report (which can be download here) contains the tables with all of our recommended plans. State-specific tax benefits can make up for less-than-compelling investment options, though the calculations get less straightforward when benefits are less generous. In our annual report, we've noted these cases and the tactics a typical investor in those states can take to optimize benefits.
Exhibit 2: Direct-Sold 529 Plan Investment Decision Criteria

Exhibit 3: 529 Tax Benefits, by State
Stepping and Sliding Down the Asset-Allocation Glide Path Investors should also look for strong investment options supported by robust teams and well-considered investment processes. Take age-based portfolios, which remain one of the most popular options within 529 plans. These portfolios systematically become less equity-heavy as the beneficiary ages, and they follow either progressive or fixed (also known as stepped or smoothed) approaches. Age-based progressive funds move more or less smoothly down the glide path, divesting stocks by a few percentage points each year, like a target-date retirement fund. However, age-based static portfolios can move more abruptly, often making double-digit percentage-point allocation changes in a single day. Industrywide, about 80% of plans--67 of 84--use a static approach, moving investor assets from one age-band portfolio to another over time. We strongly favor the smoother rebalancing process seen in age-based progressive portfolios over the more abrupt path taken by many age-based static portfolios. The latter can court significant market risk if they make big asset-allocation shifts in one day.
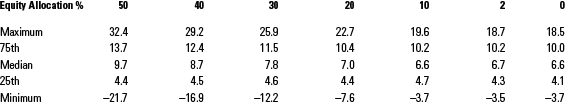
From an investment standpoint, it is true that over longer periods--such as in the 18 years before most beneficiaries enter college--a static or progressive glide path may not result in a very noticeable difference in ending balances. Over 18 years, a smoother glide path offers some minor downside protection, similar to dollar-cost averaging (basically what a smoother glide path emulates). A smoother glide path does offer investors more peace of mind in shorter-term market fluctuations and drops, though. Exhibit 4 presents various levels of equity steps seen within 529 plans and the 12-month rolling return that investors would have experienced before being rolled into the next portfolio along the age-based track.[1] Not surprisingly, a bigger step leads to a wider range of outcomes--both on the downside and the upside.
Exhibit 4: Range of 12-Month Rolling Returns for Various Equity Allocations of Age-Based 529 Portfolios (from Jan. 1, 1986 to Dec. 31, 2015)
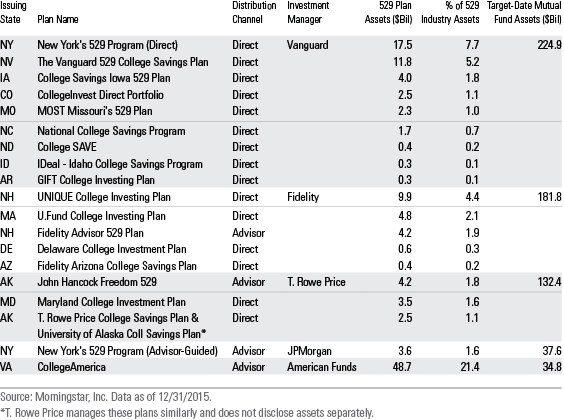
Not All Asset-Allocation Teams Are Created Equal It is also important to look at the teams charged with asset allocation for 529 plans' age-based options, as they can vary widely by experience and level of expertise. Some 529 plans hire teams that design glide paths for target-date retirement funds to construct age-based tracks. In fact, the five largest managers of target-date mutual fund assets--Vanguard, Fidelity, T. Rowe Price, J.P. Morgan, and American Funds--each have a presence in the 529 market and rely on the same asset-allocation team for both approaches. Those five firms collectively manage about 80% of target-date mutual fund assets, and they also run nearly half of 529 plan assets. Exhibit 5 shows the 529 plans run by those five firms.
Exhibit 5: 529 Plans Managed by the Five Largest Target-Date Mutual Fund Managers
Meanwhile, some 529 plans lean on external consultants with strong asset-allocation capabilities, and others rely on less proven asset allocators. Investors should seek 529 plans backed by teams with deep asset-allocation capabilities. Some of the best teams can be found in the 529 plans with Process Pillar ratings of Positive. To find out how your 529 plan and its investment options rate with Morningstar's analysts, click here.
[1] For the analysis, we used 30 years of historical returns through the end of 2015 for the S&P 500, MSCI EAFE, and Barclays U.S. Aggregate Bond indexes to represent U.S. stocks, international stocks, and fixed income, respectively, assuming that international equities made up 30% of the stock sleeve.
/cloudfront-us-east-1.images.arcpublishing.com/morningstar/HDPMMDGUA5CUHI254MRUHYEFWU.png)
/cloudfront-us-east-1.images.arcpublishing.com/morningstar/OMVK3XQEVFDRHGPHSQPIBDENQE.jpg)
:quality(80)/s3.amazonaws.com/arc-authors/morningstar/41940ba6-d0f1-493c-af96-52ad9419064e.jpg)