
Retail Stocks Shellacked Even as Consumers Open Their Wallets
Friday's retail sales report dispelled any notion that the consumer is afraid to spend, writes Morningstar's Bob Johnson.

It was a relatively quiet week for world markets as the major equity markets generally dropped between 0.5% and 1.5%. A lot of the weakness was company-specific, with U.S. retailers getting pounded as company after company reported terrible results with little optimism for much improvement. Lower inventory data generally kept oil and commodities prices moving higher, with general commodity indexes up about 2.5%. Bonds tracked even lower with the U.S. 10-Year Treasury yield now down to just 1.71%, off another 0.07% from last week as a result of poor retailer data and a surprisingly high unemployment claims figure (that may have been retail-related).
By Thursday, even we were growing increasingly worried about the U.S. economy with the combination of a softer employment report last week, a higher initial unemployment claims report, and an unending stream of disappointing first-quarter retailer earnings reports. A broad package of multiline retailer stocks was down more than 7.5% in a single week—and that included a few ringers like several of the dollar stores. However, the April retail sales report on Friday dispelled any notion of a consumer that was afraid to spend. Headline, month-to-month growth was 1.3%, well above the consensus of 0.8%. Much of the increased spending was in more discretionary categories. It became clear that retailer problems were not because of consumer lethargy, but because of shifting spending interests and massive channel shifting to online venues. The report was a game-changer and solved a lot of mysteries concerning apparently high consumer incomes and increasingly worried retailers. Unfortunately, poor retailer reports will still keep strong pressure on retail employment for months. New hiring at Amazon AMZN-related entities won't offset all those losses. And retailers probably have to play catch-up with layoffs as now there is no denying that weather was not the root problem at brick-and-mortar retailers.
The strong retail spending report combined with revisions to older data sent economists back to the drawing board as they raced each other to raise second-quarter GDP estimates (even with likely upward increases to first-quarter GDP data) to as high as 3%. Just a week ago it was hard to find many who seriously believed U.S. GDP could grow much faster than 2%. Our 2.0%–2.5% GDP growth rate for all of 2016 appears safe for another day, with consumers continuing to lead the way.
Reports on small-business hiring and economywide job openings suggest the labor market was a lot stronger than last week's headline figure suggested. Job openings are continuing to expand even as hiring stalls out, suggesting that we have an available worker issue and not a job creation problem. That's not all great news, as the labor market is bumping against some significant constraints. A hotel industry analyst at Morningstar pointed out that a speaker on the Marriott International MAR earnings conference call expected hourly wage inflation of 3%–5% in the years ahead, making profit margin expansion much more difficult than in the recent past. The small-business report contained much the same warning, with wages moving higher even as prices remain constrained.
Which to Believe, Real-World Retailer Reports or Government Data? This week, near panic set in as a series of major retailers reported disappointing results across a broad cross-section of stores including Macy's M, Kohl's KSS, JC Penney JCP, and even Nordstrom JWN. A broad base of multiline retailers was down close to 8% for the week and 19% over the past year. The excuses offered up by managements varied but included odd weather patterns, lack of foreign tourists, price declines, and company-specific missteps. Retail analysts didn't find any of the excuses very satisfying and outlooks for immediate improvement were dim. Macroeconomists whined yet again that consumers aren't spending their gas savings and are continuing to hunker down.
Retail Sales Report Counters Brick-and-Mortar Retailer Blues However, Friday's retail sales for April calmed some of those fears and made the real problem a lot clearer. Retail sales were expected to be strong with a consensus forecast of 0.8% month-to-month growth (7.2% annualized), which was blown away by actual results that grew 1.3%. Excluding autos (which were expected to be great because of previously released data) and gasoline (which benefited from higher prices), month-to-month sales were still up an incredibly strong and unexpected 0.6%. It gets better: Retail sales for the first quarter were also revised modestly higher, potentially causing an upward revision to first-quarter GDP. And given the strong start to the second quarter, the prognosis for the second quarter is excellent. The data has caused economists to scramble to raise their second-quarter GDP estimates from 2.3% or so to something closer to 3%. The Atlanta Fed GDPNow forecast for the second quarter was raised from 2.2% to 2.8%, which is up from the originally reported 0.5% for the first quarter. As we noted, that estimate is likely to be raised over the course of the next two revisions.
So How Do We Square the Horrible Reports From Retailers With Relatively Strong Retail Sales Data? We believe the mix of what consumers are buying and where they are buying it has put conventional brick-and-mortar retailers in a very bad place. On a month-to-month basis, almost every category did very well. That is, with the notable exception of general merchandise store sales, which were flat month to month and were up a pathetic 0.5% year over year. Nonstore retailers (that is, Amazon) saw sales growth jump to over 2% month- to-month and a stunning 10% year over year. At that pace, nonstore retailers will be bigger than general merchandise stores within the next couple of years. (Currently, nonstore retailer sales are 19% below general merchandise sales.) Indeed, our retail team has predicted that online retailing had reached a tipping point, and that online sales were likely to accelerate.
Besides Amazon, Apparel Helps Sink Brick-and-Mortar Results Second, the key apparel category has been suffering from weather issues and consumers' move to more basics and value based fashions. Even, Hanesbrands HBI, the underwear company, is reporting that customers are increasingly buying underwear on an as-needed basis and are forgoing fashion/fun purchases that drove demand just a few years ago. Demand at lower-price apparel retailers has remained healthy and is likely stealing share. We suppose some of this is just a normal cycle, but an aging demographic, which tends to spend less on clothing, is not helping matters, either. Apparel sales are up just 1.9% on a year-over-year basis, though month-to-month apparel sales did look better, rebounding from some nasty, perhaps legitimate warm weather issues during the first quarter.
Year-Over-Year Data Suggests Consumers Are Spending, Just at Different Places
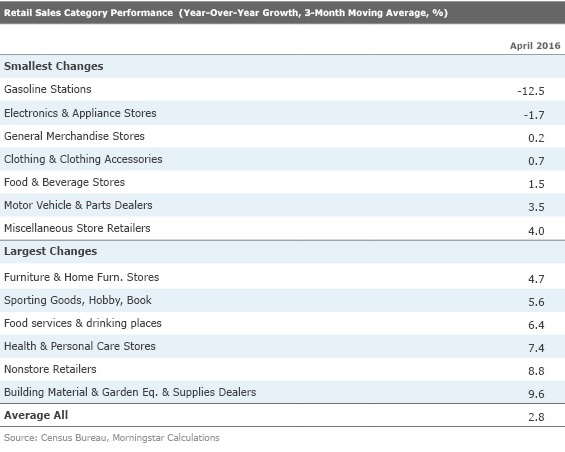
The year-over-year category data suggests some significant shifts in how consumers are spending their money. Beyond the Amazon phenom, consumers are spending more fixing up their homes, on healthcare, and meals out at restaurants. Adjusted for ever-decreasing prices (8% deflation), electronics sales growth would have been ahead of restaurant sales growth (2.7% inflation). This is not the portrait of a scared-to-death afraid-to-spend consumer that the media is desperately trying to portray. We aren't buying the thesis of insurance, healthcare, and housing eating into consumers' discretionary spending, either. Certainly, spending on some of those categories is greater than it was, but others are down considerably, including food, energy, and interest expense. Annual, inflation-adjusted retail sales growth of 4.4% is actually ahead the 3.8% average that has prevailed since 1992. How and where consumers spend that money have shifted.
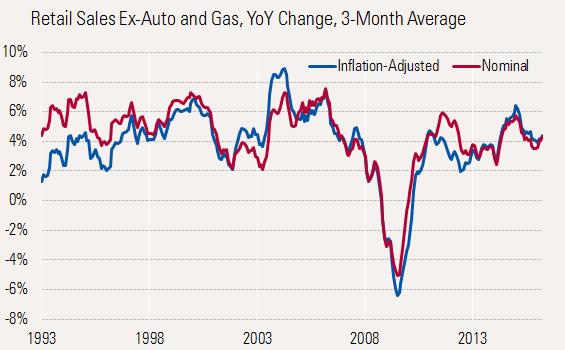
Source: U.S. Census Bureau
Focusing only on the current recovery back to 2010, retail sales overall look incredibly stable despite a fair amount of category shifting. The graph below zooms in on results for the past six years.
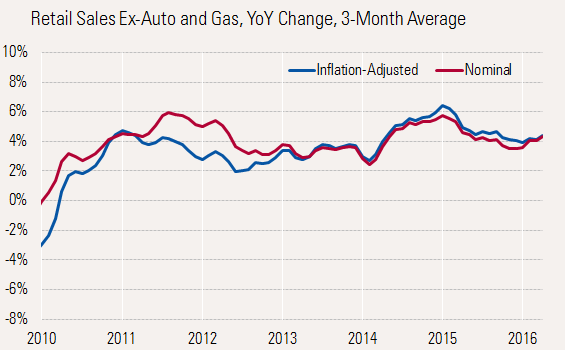
Source: U.S. Census Bureau
Retail Shifting Impact on Employment Remains Uncertain There is no simple answer to that question. Simplistically, conventional brick-and-mortar retailers will likely have to retrench, close stores, and lay off workers. We have already seen a number of bankruptcies over the past year, including Sports Authority, Quicksilver, American Apparel, and Aeropostale, to name just a few. Direct retail employment growth in April was nonexistent and is likely to get worse. We had expected to see some contraction in earlier months, but we believe retailers clung hard to retain workers in hopes that the sales issue was all about weather. Retailer issues obviously extended way beyond weather. The next few months could be payback time for retail employment and initial unemployment claims.
Will Amazon, UPS, and U.S. Service Providers Save the Day? However, employment growth resulting from package deliveries and Amazon-like warehousing will offset some of those direct losses. A shift away from apparel (which is primarily imported) to auto and restaurant meals will also tend to help U.S.-based employment over the longer term. (It also explains why import data has been so soft recently, despite a relatively healthy economy.) Unfortunately, the shifts in the evolving retail industry won't necessarily be smooth and may distort a lot of economic data--not just employment--through the rest of the year.
Labor Shortages Intensify The National Federation of Small Business Sentiment Report and the federal government's Job Openings and Labor Turnover Survey provide important clues to the health of the labor market, and supplement our understanding of the April employment report last week. The JOLTS report indicated that openings at the end of March jumped while hiring barely budged at all. This is a telltale sign that the relatively low growth shown in the employment report was related to a lack of available workers and not a shortage of jobs. It also indicates a mismatch of skills, which is not entirely a good thing for the economy. The difference between hires and openings gapped open again for March, in favor of openings, as shown below.

The surge in openings occurred almost entirely in the high-paying professional and service category on a month-to-month basis. These are not low-paying jobs. On the other hand, as one might suspect, retail openings declined by 80,000 month to month. However, year-to-year openings are still up, suggesting that management teams have not been aggressive enough in adjusting hiring levels and that more pain may lie ahead.
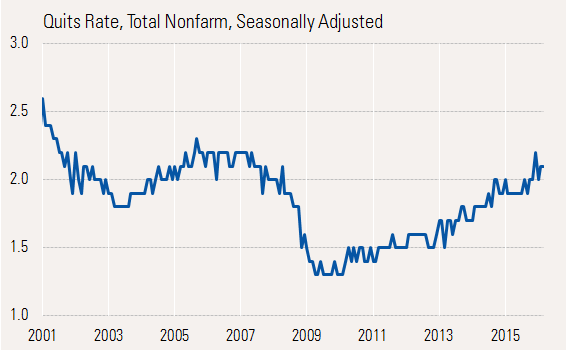
Quits Data Suggests Continued Worker Confidence Quits remained high at a 2.1% rate, just a notch short of the recovery high of 2.2%. This suggests that workers are feeling more confident. The current level of quits is where it was near the top of the last economic cycle in 2007, though still below the record level of 2.6% in early 2001, when the U.S. Labor Department started keeping records.
Small Businesses Struggle to Find More Employees Small businesses reported a large jump, month to month, in the percentage of businesses claiming that there are few or no applicants for available posted jobs. The month-to-month pop was large, from 41% to 46%, however, the three-month average was little changed and still at very elevated levels compared with the rest of the current recovery and the top of the last economic cycle. Small businesses are finally stepping up their compensation plans a bit, after a short lull, in an effort to finally fill open positions. The percentage of firms giving raises is even higher (versus intentions shown on the graph on Page 7). Given the large number of unfilled openings, more wage growth is highly likely. The same phenomenon was documented in last week's April employment report that showed higher hourly wage rates.
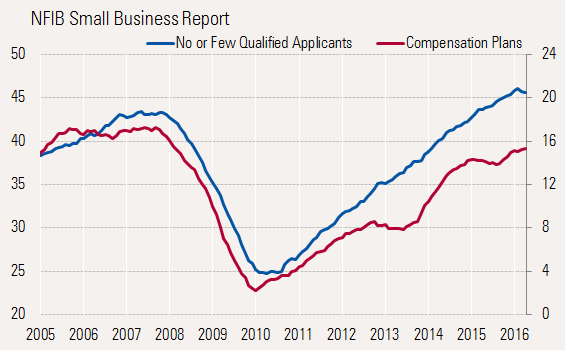
These higher wages, while it remains exceptionally difficult to raise prices, are pressuring small-business profits. Though improved modestly in April, this profit squeeze has soured overall small-business sentiment, which remains perilously close to the lows of the past two years.
Federal Budget Data Worse Than Expected The long string of relatively good news on the federal budget deficit came to an abrupt halt as tax revenue in the important month of April came up short of March Congressional Budget Office estimates. According to CBO, tax receipts for the first seven months of the year were as much as $50 billion below earlier estimates, on a total estimated revenue base of $1,917 billion and a full-year budget deficit that was previously estimated at about $500 billion (when adjusted for the extra Social Security payment in 2016). Even before the recent shortfall, the fiscal year 2016 deficit was higher than the $434 billion deficit reported in 2015. However, the $50 billion revenue miss was partially offset by $8 billion of receipts from the sale of frequency spectrum and a $15 billion reduction in accruals for potential losses in Housing and Urban Development loan funds. The net result of the revenue shortfall, frequency sales, and lower expenses was a deficit that was $28 billion higher than CBO's previous view. CBO is worried that the revenue shortfall could continue through the rest of the year, though they are not changing their formal forecasts at this time. We continue to believe the deficit won't be a huge issue for the next couple of years, but increased baby boomer retirements and a return to more normal interest rates will drive the deficit uncomfortably higher over the following eight to 10 years.
Fiscal year to date, the deficit is $311 billion compared with $284 billion, or about $28 billion higher. Revenue grew a measly 1.4% while spending was up 2.4%. Revenue growth was depressed by poor tax collections in the April tax cycle, for both corporations and individuals. The much smaller corporate tax sector has fallen 10% year to date through a combination of lower corporate profits and the last-minute corporate tax reductions at the end of calendar 2015. CBO anticipated some volatility in corporate taxes. However, the shortfall on the individual market was quite a surprise. Lower small-business profits (that often flow through individual returns) and capital gains appeared to be the two primary culprits of the tax shortfall. Payroll taxes, while just a little soft, were much less affected. The 2016 stock market has not been great so far and business profits remain under pressure, so we suspect collections will look light for the remainder of fiscal year 2016.
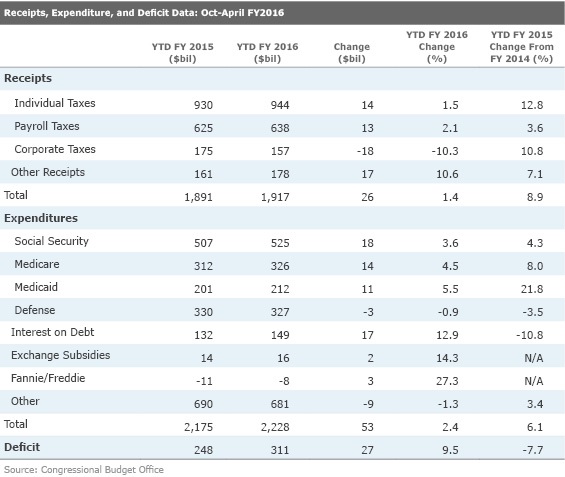
The good news is that expenditures are also running a bit below plan, offsetting some of the revenue shortfall and helping to avoid an even larger deficit increase. Notably, defense spending and discretionary categories are running below year-ago levels. However, without the spectrum sales (recorded as reduction in FCC expenditures) and the lower HUD expense noted above, the Other category would have increased by about 2%, still a modest increase. Combining revenue and expenditures, the deficit is up 9.5% year to date, again adjusting for the extra month of Social Security payments made in 2016 (April's and May's checks were both mailed in April this year).
Housing, Prices, and Industrial Production all on Tap for Next Week It will be hard to top this week's blowout retail sales report with next week's data, but one can never say never. Better retail data for April will clearly take some of the pressure off of housing data, which carried the ball in the first-quarter GDP report. The housing data has had weather and seasonal adjustment issues that have made housing data look goofy and not wonderfully consistent. And as good as housing has been, it still hasn't been as great as most had hoped and certainly hasn't offset manufacturing softness as we had hoped. April housing starts are expected to be slightly better than in March at 1.13 million (which looks a little optimistic to us, given permits and softer employment data). Existing-home sales, reported later in the week, are expected to be little changed given low inventory levels, though pendings data suggests month-to-month sales should be up about 1.5% or slightly better than the consensus forecast.
Headline consumer price inflation for April is expected to be a relatively high 0.3% because of higher gasoline prices. We suspect that lower food prices and perhaps apparel prices may make that forecast look a bit too high. As always, we will be looking most closely at services inflation along with healthcare. We aren't expecting this report to be a game-changer, especially on a core or a year-over-year basis, although economists seem to be expecting bad things (much higher inflation).
The industrial production numbers will require a lot of special attention next week as earthquakes in Japan forced the closure of some U.S. facilities in April, potentially having relatively substantial effects. Better purchasing manager reports, manufacturing hours worked, and payroll stabilization all suggest a better report (manufacturing only) with growth of as much as 0.3%. So if Japan does have an impact, it could come as a nasty surprise to some. We will provide a more careful analysis next week. In any case, manufacturing is not a key driver for the U.S. economy at this moment.
/cloudfront-us-east-1.images.arcpublishing.com/morningstar/T5MECJUE65CADONYJ7GARN2A3E.jpeg)
/cloudfront-us-east-1.images.arcpublishing.com/morningstar/VUWQI723Q5E43P5QRTRHGLJ7TI.png)
/d10o6nnig0wrdw.cloudfront.net/04-22-2024/t_ffc6e675543a4913a5312be02f5c571a_name_file_960x540_1600_v4_.jpg)