
Average Fund Costs Continue to Decline in 2015
But investors are not necessarily paying less.
/s3.amazonaws.com/arc-authors/morningstar/de44b91c-c918-4e53-81c3-ce84542f3d36.jpg)
The following is an excerpt from Morningstar's most recent study on fund fees.
Our study of U.S. open-end mutual funds and exchange-traded funds finds that, on average, investors paid lower fund expenses in 2015 than ever before. The asset-weighted average expense ratio across funds (excluding money market funds and funds of funds) was 0.61% in 2015, down from 0.64% in 2014 and 0.73% five years ago. This decline stems from investor demand for cheaper passive funds (index funds and ETFs) and strong flows into institutional share classes, which carry lower fees. Vanguard also contributed to average fee declines, as its low-cost passive funds continue to attract large flows.
But lower average fund expenses do not necessarily mean investors are paying less for their investments overall. We've seen the strongest inflows to institutional share classes through retirement platforms and to ETFs via fee-only advisors. These channels typically levy another layer of fees in addition to the cost of owning funds, so investors need to consider their total cost of investing. Advisor and retirement platform expenses are beyond the scope of this fund fee study, but they are an increasingly important cost component as investors migrate toward investment services and products with these fee structures.
The recently released U.S. Department of Labor's final Fiduciary Rule states that any industry professional providing investment advice to IRAs and retirement plans (such as 401(k)s) must put the interest of the investor first, primarily by focusing on costs. This rule may result in more scrutiny and better transparency on the total cost of investing, which we hope will lead to lower investment expenses for the average American saving for retirement.
A Look at the Averages: Asset-Weighted Versus Equal-Weighted On average, U.S. investors are paying less fund expenses. The asset-weighted average expense ratio across funds, including open-end mutual funds and exchange-traded products (but excluding money market funds and funds of funds), was 0.61% in 2015, down from 0.64% in 2014 and 0.73% five years ago. Much of this decline was the result of very strong flows into passive investments, which typically carry low expense ratios, and strong flows into lower-fee share classes. Vanguard has also contributed to average expense ratio declines as it continues to attract very large flows into its low-cost passive funds.
The asset-weighted average expense ratio is a better measure of the average cost borne by investors than a simple average (or equal-weighted average), which can be skewed by a few outliers, such as high-cost funds that have low asset levels. In 2015, the simple average expense ratio for all funds was 1.17%, but funds with an expense ratio above that level held just 8% of fund assets at the end of 2015. (So it isn't saying much if a fund company touts "below average fees.") If we look at the largest 1,000 share classes, which account for about 75% of assets in mutual funds and ETFs, the simple average expense ratio remained at 0.64% from 2013 through 2015, as some fees go up and some go down. This finding suggests that in aggregate, changes in the fees set by asset management firms across the industry are not contributing to the falling asset-weighted average expense ratio.
Indeed, in Exhibit 1, active funds have seen larger asset-weighted average fee declines when compared with passive funds. This might lead to the conclusion that fee declines among active funds are driving overall fee declines, but this has not been the case. Instead, it has been flows out of more-expensive funds (often active funds) and into cheaper funds (primarily passive funds) that have resulted in lower asset-weighted average fund fees.
Exhibit 1: Asset-Weighted Average Expense Ratio for Funds Continues to Decline in 2015
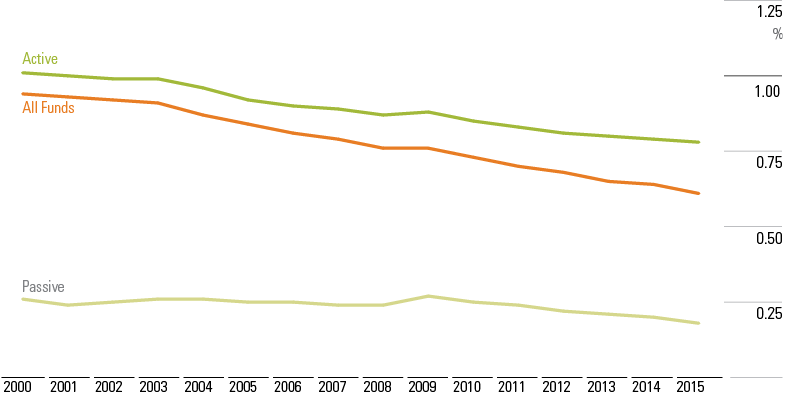
Source: Morningstar. Data as of 12-31-15.
Trends by Fee Group: Follow the Flow Into Low-Cost Passive Funds During the past five years, low-cost funds have attracted strong inflows at the expense of pricier funds. Funds with expense ratios ranking in the least-expensive quintile of all funds ("low-cost funds") attracted an aggregate $1.7 trillion of estimated net inflows, compared with $372 billion of net outflows for funds in the remaining four quintiles ("more-expensive funds") during that time period. Within the lowest-cost quartile, passive funds have accounted for an average 75% of flows during the past five years, with active funds accounting for the remaining 25%.
More recently, the pattern of flows has diverged even more; in 2015, low-cost funds saw $303 billion in inflows, while more-expensive funds suffered $260 billion in outflows. This largely explains the 3-basis-point decrease in the asset-weighted average fund expense ratio to 0.61% in 2015.
Exhibit 2: Flows Increasingly Move Toward Funds With Fees in the Lowest Quintile (Quintile 1)
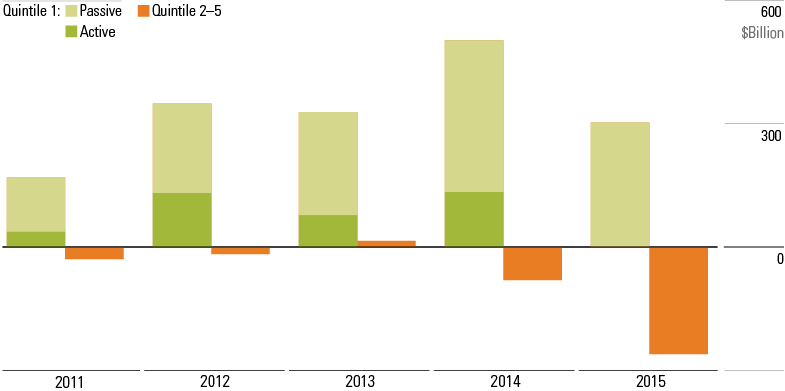
Source: Morningstar. Data as of 12-31-15.
Active funds still dominate fund assets held by investors, with a 70% market share, but this is quickly changing as passive funds, typically open-end index funds and ETFs, have increasingly been the primary recipients of the capital flowing into funds. Passive funds carry low fees: As they simply track an index, they are relatively cheap to operate. Active funds, on the other hand, are more costly to operate as they need to employ a team of portfolio managers and analysts who conduct research and make "active" decisions on where and when to invest.
The asset-weighted average expense ratio for passive funds was just 0.18% in 2015, compared with 0.78% for active funds. With such a large gap in fees, rising flows into passive funds contributed to falling asset-weighted average expense ratios. In 2011, passive funds gathered $140 billion more than active funds. In 2015, this gap widened to $575 billion. This is despite the fact that there are eight active funds for every passive fund. In 2015, passive funds accounted for almost all of the flows into the category of low-cost funds.
Exhibit 3: Difference in Flows to Active and Passive Funds Has Widened
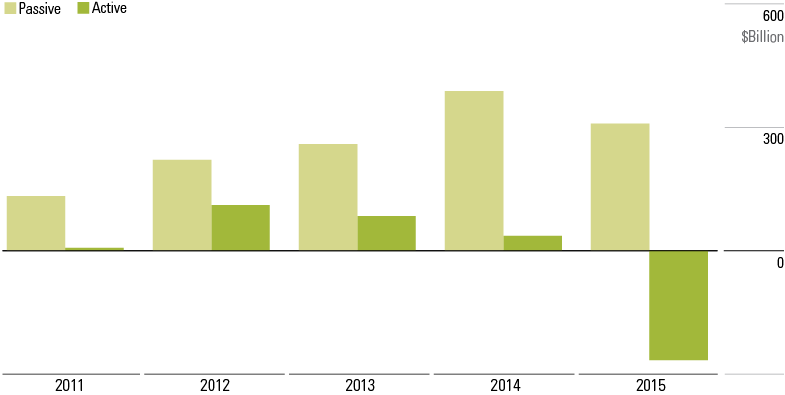
Source: Morningstar. Data as of 12-31-15.
The trend toward passive funds has become more dramatic as the difference in flows between active funds and passive funds grows ever larger. From 2011 through 2014, estimated net flows into passive funds hit $1 trillion, with net flows into active funds coming in at about a fourth of that amount, at $237 billion. In 2015, active funds saw a large net outflow, resulting in a net flow difference of $575 billion between active funds and passive funds. (Since 1990, active funds have seen outflows only once before, in 2008.) With such strong inflows, passive funds have seen their market share rise quickly against their long-dominant active fund peers. Passive funds now account for 29% of the total assets in the universe we examined, up from 14% in 2005.
:quality(80)/cloudfront-us-east-1.images.arcpublishing.com/morningstar/OMVK3XQEVFDRHGPHSQPIBDENQE.jpg)
:quality(80)/cloudfront-us-east-1.images.arcpublishing.com/morningstar/WJS7WXEWB5GVXMAD4CEAM5FE4A.png)
:quality(80)/cloudfront-us-east-1.images.arcpublishing.com/morningstar/NOBU6DPVYRBQPCDFK3WJ45RH3Q.png)