
Should Investors Be More Worried About Manufacturing and Earnings Data?
Market participants are instead cheering a rise in oil prices and the fact that earnings season could be a lot worse.

It was unusually difficult to find much of a pattern in this week’s data. Emerging markets were down fractionally, while the U.S. was up a tiny 0.6%. Europe did better, gaining 1.7%, while commodities returned an exemplary 3.7%. Meanwhile, the interest rate on the 10-year U.S. Treasury was up 0.14% to 1.89%.
After good earnings news from the financial sector last week, news out of high-profile tech stocks was not good. Both
Economic news was mixed and confusing, limiting the impact on market activity. On a historic note, weekly unemployment claims logged another all-time recovery low last week as claims fell to 247,000, the lowest level since 1973. Weekly retail sales, on a year-over-year basis, also continued to improve. Short-term housing data was mixed with housing starts and permits both falling and existing-home sales gaining, basically cancelling each other out in investors' minds. However, the longer trend shows accelerating interest in new single-family homes, a topping out in the apartment market, and a glacially slow existing-home market. Markit purchasing manager data dashed hopes of a manufacturing sector improvement as Europe, Japan, and the U.S. all registered declines in this week’s report. However, earthquakes in Japan last month and the knock-on effects of worldwide supply chains may have been a factor, too.
Next week's GDP report is likely to be worse than in the fourth quarter and lower than 1%. The market has slowly come around to this conclusion, so the poor report is finally pretty well anticipated. Market participants don't seem as worried as one might expect, instead cheering a rise oil prices and the fact that earnings season could have been a lot worse. Not much action is anticipated at next week's Federal Reserve meeting, although some worries are creeping up that the official statement might contain some hints about the upcoming June meeting. That may have helped weigh on bonds this week.
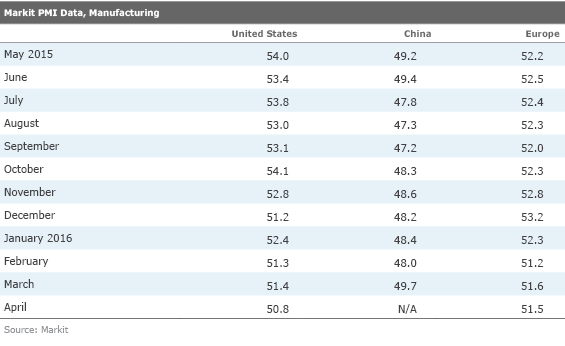
March Manufacturing Excitement Fades Quickly With April Data Most of the major Markit purchasing manager data improved nicely in March, leading to hopes that this sector--key for some regions--was firmly on the mend. There was also a lot of hope that more European stimulus would show up in better manufacturing data in April.
However, the April flash reports from Markit threw a bucket of cold water on those dreams. Europe's manufacturing data was down very modestly, while the U.S. and Japan both showed healthy declines. Chinese data, as is the recent custom, will not be available until early May. We can only hope that the Chinese data looks better than other world results released on Friday.
There is no denying the manufacturing data is weak. Now that many regions in close proximity to each other have adopted new stimulus measures, none has done much good for manufacturing. Slowing energy-related spending and a poor commodities cycle are likely to keep pressure on the manufacturing sector despite the best attempts of central bankers.
Despite the glum reports, we aren’t panicking. Portions of manufacturing that are doing better temper our worries. In addition, a mini-inventory adjustment in the U.S. and Japanese earthquakes that idled some Japanese manufacturing plants have put some temporary pressure on manufacturing data. We understand that with U.S. supply chains stretching back to Japan, even U.S.
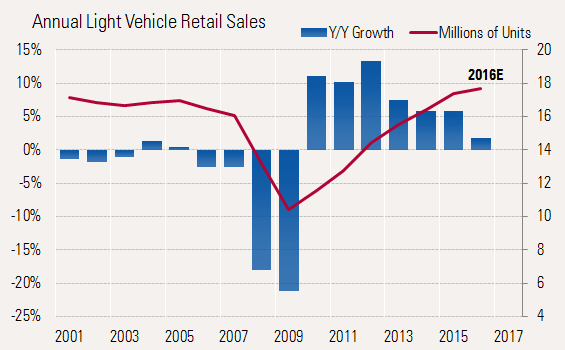
Plus, we noted last week that high auto inventory at one
European Manufacturing Economy Not Accelerating Despite New Stimulus The manufacturing flash PMI for April decreased modestly from 51.6 in March to 51.5 in April. The good news is the index is above 50, indicating growth; the bad news is the reading isn't all that much above 50 and is not accelerating. The April reading is also below the January reading (also the first month of the quarter) and the same month a year ago, suggesting GDP growth in the second quarter of 2016 could be even more tepid than the 0.3% (1.2% annualized into a U.S. equivalent) real GDP growth rate of the first quarter.
By subindex, European employment was up slightly. The more forward-looking new orders category also improved modestly, and while certainly not robust, at least it was at a three-month high.
By major region, the German manufacturing economy improved considerably in April, driven largely by improved export orders. France, on the other hand, continues to grow ever more worrisome with its index dropping from 49.6 to 48.3. Poor new-order data suggested even further possible deterioration in the French manufacturing sector.
The larger services sector composite infinitesimally improved in April from 53.2 to 53.1.
Japan and U.S. Data Both Slumped in April We usually don't focus much on either the Japanese data (not as large as China, Europe, or the U.S.) or on the U.S. report (we like the longer track record of the ISM survey, due in early May). However, continued deterioration in Japan and the U.S. combined with the modest slump in Europe, suggests a worldwide deterioration in manufacturing. The U.S. manufacturing index dropped from 51.4 in March to 50.8 in April. Energy sector issues were cited as one of the problems, as were export sales. Also, attempts to rein in both raw material inventories and finished goods are evident in the U.S. data, suggesting the problem isn't necessarily about final demand. Interestingly, vendor deliveries also worsened considerably, possibly suggesting the runoff of inventories won't last a lot longer.
Poor Japanese Data May Partially Reflect Recent Earthquakes
Because we don't track the Japanese manufacturing sector closely, we can't offer a lot of context. Still the PMI index slipped badly from 49.1 to 48.0, now firmly in contraction territory--that is, below 50. New orders, export orders, and current production all fared poorly, suggesting the downturn may not be short-lived. Two earthquakes in key Japanese manufacturing regions may explain some but not all of the recent weakness. The index had already been below 50 in March, before the earthquakes in mid-April temporarily closed some
Home Data Positive but Misunderstood This week three different housing metrics were released. The month-to-month data for February to March provided something to make everyone happy. Builder sentiment readings were unchanged, but at a relatively bullish level. Housing starts declined 9%--a large disappointment to some--and existing-home sales appeared to have surged, jumping 5%, surprising everyone on the upside. However, the month-to-month data remains volatile and highly suspect. The real story--the year-over-year story--is just about the opposite of the many headlines trumpeted in response to the monthly numbers.
To detangle some of the mess, the trends become a lot clearer when viewed on a 12-month rolling basis. This takes out some of the weather jumpiness and shifting seasonal factors. Then, we want to take housing starts out of the equation, because they are very susceptible to weather conditions. Starts are notoriously difficult to measure because they involve sending someone to an actual job site. Permits are less subject to weather issues and involve one simple trip to the clerk's office. Most permits do turn into a housing start, and most U.S. regions require building permits.
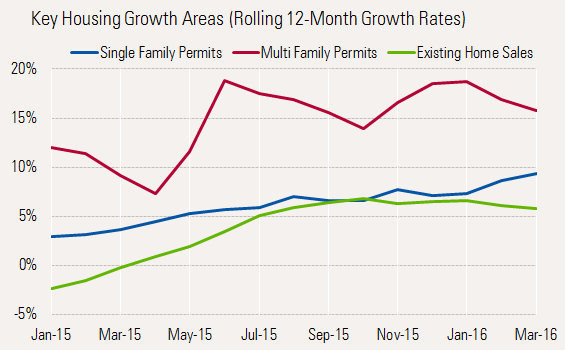
Source: U.S. Census Bureau, National Association of Realtors, Morningstar calculations
Multifamily permits appear to have stalled out at relatively high levels, and short-term data indicates that further deterioration appears possible in the months ahead. March 2015 permits were lower than any time in the past 12 months on a seasonally adjusted basis. Given that the favorable demographic trends are about to come to an end for the 24-to-31-year-old segment, and as units started more than a year ago come on the market, we believe growth in this segment is likely to continue to slow.
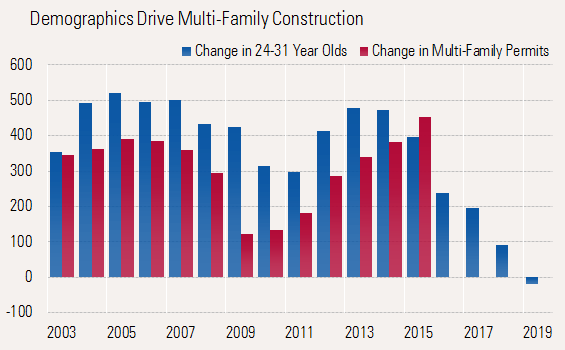
Source: U.S. Centers for Disease Control, U.S. Census Bureau, Morningstar
Fortunately, even with all the recent growth, apartment construction is less than a third the size of the single-family home market in terms of dollars. Meanwhile the slower-growing single-family market is slowly picking up steam as demographics turn in favor of the market. Existing-home sales continue to slow ever so gradually as tight inventory conditions and high prices weigh on this market. Existing-home sales, via brokerage commissions, contribute about two thirds of the amount to GDP as single-family home constructions. Given growth in the largest segment of residential investment, we remain optimistic about housing overall. Still the dynamics of individual segments continue to shift, confusing a lot of the data and a lot of economists. A slowdown in some portions of the housing market (apartments and existing-home sales) will make it more difficult for housing to be a bigger contributor to the economy in 2016 than it was in 2015.
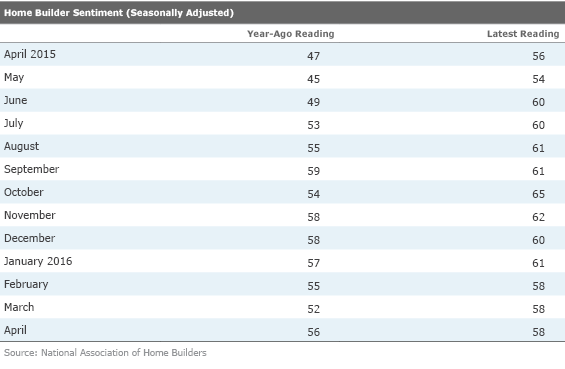
Builder Sentiment Little Changed Builder sentiment has remained stuck at 58 for the past three months. Though we wish the metric were higher, it remains above 50 (more than half of builders believe things are improving). It is also nicely above levels at the same time as a year ago, suggesting that this year's building season will be better than last year's. Most of the year-over-year improvement in sentiment seems to be concentrated in the West. The report also suggests that new home sales data next week will likely be little changed month to month, but much better than last year's rather poor March performance.
Yet More Housing Data, First-Quarter GDP Data, and Another Read on Manufacturing As we have been projecting for the past several weeks, we suspect the first-quarter GDP report won't be pretty. The consensus estimated for first-quarter GDP growth has now dropped back to 0.7%. The mechanical calculation from the Atlanta Fed's GDPNow report is an even lower 0.3%. We still think something in the 0.5%-1% range makes sense, but shifting prices or the potential for a bad trade report for March and seemingly declining inventories could all shift the report either way. We still believe in our full-year forecast of 2.0%-2.5% GDP growth, driven by the consumer, residential investment, and an improving government calculation. We remain relatively confident in our forecast despite a rough first quarter. Seasonal factors and weather make it very tough to draw many conclusions from first-quarter data. The first quarter has been the weakest quarter of the year in three of the past four years.
Pending home sales data should give us some feeling as to the start of the spring selling season. This indicator correctly predicted the nice bounce in existing homes in March. This report should give us a good idea if the stronger March data was just a fluke or the start of something better than we are currently forecasting. As we mentioned above, the builder sentiment report suggests flattish new home sales month to month or about 515,000 units, which is just about where the consensus is. However, larger inventories of homes that are available for immediate sale could provide a lift to the report.
Durable Goods: Time for a Bounce? Core orders are expected to return to the black in March with headline orders, driven by defense and commercial aircraft, expected to be up 1.9%--though without transportation, our expectations are for much slower 0.5%. We suspect that some of the manufacturing issues we discussed earlier could make these expectations a bit optimistic. Though some better numbers (off a very nasty decline in February) are a possibility, as good and bad months have had a habit of alternating lately, producing no real forward motion in manufacturing activity.
Note: This article has been corrected since original publication. Weekly unemployment claims fell to 247,000, not 253,000, as stated in the original text.
/cloudfront-us-east-1.images.arcpublishing.com/morningstar/54RIEB5NTVG73FNGCTH6TGQMWU.png)
/cloudfront-us-east-1.images.arcpublishing.com/morningstar/ZYJVMA34ANHZZDT5KOPPUVFLPE.png)
/cloudfront-us-east-1.images.arcpublishing.com/morningstar/MNPB4CP64NCNLA3MTELE3ISLRY.jpg)