
Did the Fed Forget to Look at the February Inflation Report?
Core inflation may be heating up as the Fed is putting too much confidence in low energy prices.

World equity markets stretched their weekly winning streak to five, with markets generally increasing between 0% and 3%, Europe hardly moving, and emerging markets gaining close to 3%. The U.S. Federal Reserve's reluctance to tighten further this week, combined with last week's European easing, powered the emerging-markets performance. On the other hand, the Fed's lack of action dulled the effects of moves the European Central Bank made last week and undercut Europe. Commodities also increased for the fifth week in a row, this week gaining about 1% as oil closed at almost $40 per barrel. Both equities and oil prices, perhaps not by chance, bottomed the week ended Feb. 11. Interest rates, like Fed policy, were little changed on the week, although the 10-year U.S. Treasury bond yield fell modestly to 1.87%.
This week's price movements seemed primarily related to the Fed meeting on Wednesday. The Fed did not raise rates, which was expected, and a poll of individual governors seemed to indicate that most expected just two rate increases this year instead of the previous guesses of three or four. Most of the Fed's economic forecasts were little changed. It is expecting lower energy inflation, which it seems to believe will take off some of the pressure to raise interest rates sooner. However, this week's detailed inflation data grew more worrisome even as the headline report for February showed a seemingly tame deflation rate of 0.2%, driven almost entirely by falling energy prices, which are already rising again in March. Some inflation indicators, especially in the services sector, are approaching prerecession levels. In our opinion, the Fed is playing with inflationary fire. Other central bank easing programs and market volatility may have forced the U.S. Fed to the sidelines for now.
The inflation news was by far the biggest news of the week, but not fully appreciated by markets. Retail sales looked poor on a month-to-month basis and might even have looked worse if adjusted for inflation. Still, the monthly data has been surprisingly volatile while the year-over-year, averaged data remains rock-steady. Therefore, we are not sweating just yet. Some individual retail sales categories also looked quite strong, relieving at least some of the tension.
While headline industrial production looked soft, driven by another month of weather-related utility declines, manufacturing-only data managed to eke out another month of improvement.
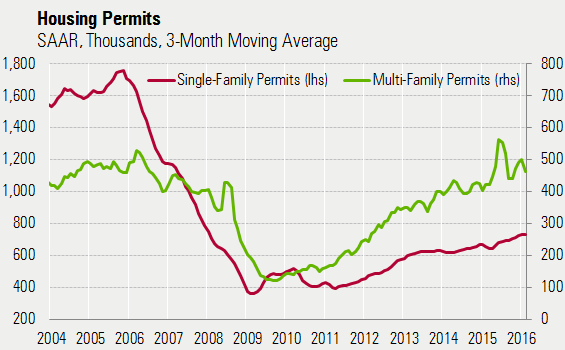
New housing starts and permits generally did better than expected and were consistent with 10% growth in 2016. Also, the interest seems to be shifting to the more economically beneficial single-family market and away from apartment buildings.
Fed Leaves Rates Unchanged for Now The March Fed meeting didn't produce many surprises. As widely expected, the majority of Fed governors appear to believe there will be fewer hikes in the Fed Funds rate in 2016 than they did at their December meeting. This cheered markets for most of this week. Data and opinions the governors presented at the December meeting, as well as at the press conference, said that given economic expectations for 2016, the Fed Funds rate could increase 3 or 4 times in 2016, working its way to 1.4% from the current 0.4% rate. At the March meeting, the opinions of the individual governors suggested a Fed Funds rate of just 0.9%. Those opinions are shown in the bottom two lines of the table below. Given that rate hikes usually happen in quarter-point increments, the collective (but independent) governor forecasts suggested that only two increases would happen in 2016.
There wasn't a lot of change in the governors' underlying economic forecasts (the top two lines of the table), so it appears that volatile markets, slowing world economies, and actions of other central banks may have been weighing on the Fed's decision.
As we discuss next, inflation rates seemed to be heating up a bit in February, but that did not seem to be a particular concern of the Fed, as falling energy prices early in 2016 may have bought the governors a few more months before headline inflation accelerates to above 2%. Notice the all-in (with energy and food) PCE inflation rate forecast for 2016 has fallen sharply from 1.6% to 1.2%. Meanwhile, core inflation rates are unchanged at 1.6% for 2016. The difference is slumping energy prices. Our fear is that core inflation may be heating up, and the Fed is putting too much confidence in low energy prices to contain inflation. While we are not expecting a return to 1970s-style inflation, it will potentially creep high enough to slow economic activity if the Fed is not careful. Please see our weekly video for more details.
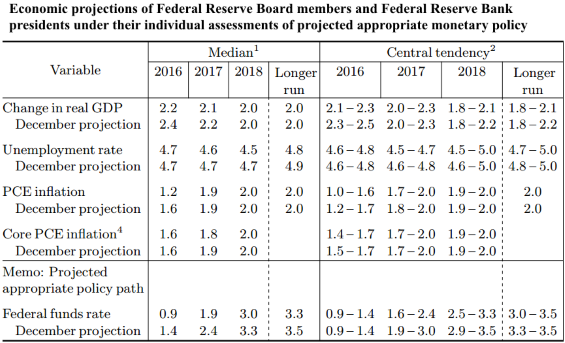
Source: Federal Reserve
Core Inflation Anything but Benign Despite Headline Deflation for February As has been the typical pattern of late, most reporters ran with the headline inflation data that showed consumer prices declining in February. Headline numbers showed prices declining 0.2% month to month and just 1% even on a year-over-year basis.
The seemingly benign numbers were anything but. Core inflation excluding food and energy jumped 2.3%. Worse yet, service sector inflation, excluding energy services, jumped 3.1%. Shelter prices, mainly rent, jumped 3.3%, the highest level since 2007. Year-over-year medical prices were up 3.5%, the highest level since 2012. Health insurance is up 6% year over year, and motor vehicle insurance rates moved higher, increasing 5.1%. To make matters worse, after almost a year's worth of price deflation, the goods sector excluding food and energy showed a modest increase in February. A stabilizing dollar most likely means that we can't count on goods deflation and slow world demand to suppress rising service inflation indefinitely. While the role of energy prices in reducing inflation is well understood, the impact of a strong dollar and low import prices are much less appreciated by the market.
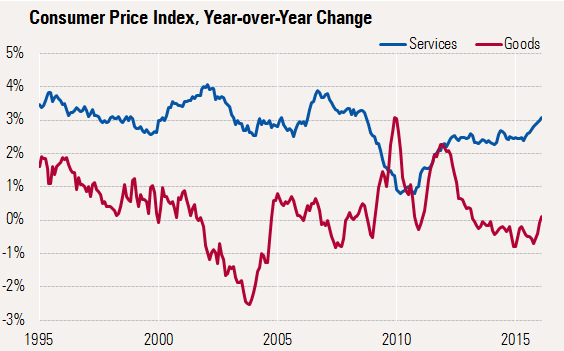
Source: Bureau of Labor Statistics
Energy Prices May Suppress the CPI Through August Energy prices in the most recent CPI report were down 12.5% year over year and account for about 6.6% of the total CPI calculation. Combining the weight and the percentage decline, energy reduced inflation by over 0.8% on a year-over-year basis. That level of reduction could continue through August if gasoline prices stay where they are now. Last year, gasoline prices surged in the spring and early summer from $2.04 per gallon in January to $2.85 by mid-July and remained relatively high through mid-August, ensuring that in 2016 year-over-year energy price decreases would suppress the CPI calculation for at least several more months. Of course, this is all based on the hope that energy prices don't have another spring surge in 2016.
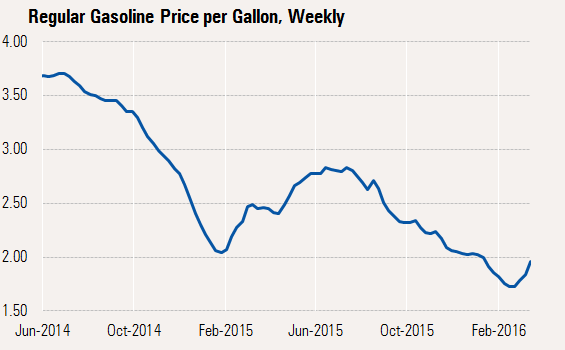
Source: FRED/U.S. Energy Information Administration
We believe that may be why the Fed is guessing that it has a little more breathing room to keep interest rates low. Then, as we begin to pass the big gasoline price declines of last fall, the help from the energy sector all but disappears by December--that is, if energy prices stay about where they are today. Then the underlying rate of inflation begins to show through. Core inflation, excluding food and energy (the blue line below), is currently running over 2%, and showing signs of acceleration. As energy price declines slow, likely by year-end, total headline inflation (orange line) should approach the core inflation rate. Either because of a geopolitical event or an oil producer disruption, there is also some risk that energy prices do not just stabilize, but increase by year-end. That will potentially move headline inflation above the core rate, which is already showing signs of acceleration on its own.
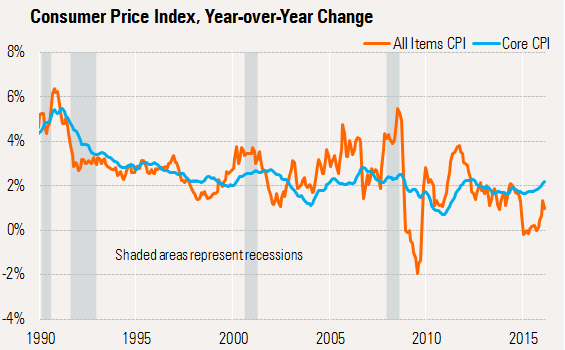
Source: Bureau of Labor Statistics
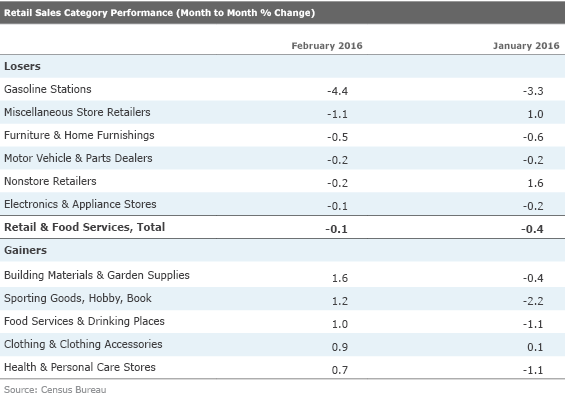
Retail Sales Volatile Month-to-Month; Year-Over-Year Data Stable As usual, the monthly retail sales report was nearly impossible to analyze because of inflation/deflation and revisions to past data. Showing the month-to-month data for January and February next to each other shows just how squirrelly the month-to-month data can be, so we aren't going to spend a lot of time discussing it.
While the big February losers at the top of the chart managed to show persistence (similar weakness in both January and February) of several low-performing categories, the monthly gainers showed dramatic monthly reversals. When you see unnaturally large swings in both directions, it suggests some type of data collection/measurement issue and not real economic trends. We commented in our video on retail sales last month that it was highly unlikely that restaurant sales fell so drastically (revisions made the January decline look even worse). Sure enough, restaurant sales jumped an equally unlikely 1% in February. You can see that pattern across all of the big February gainers.
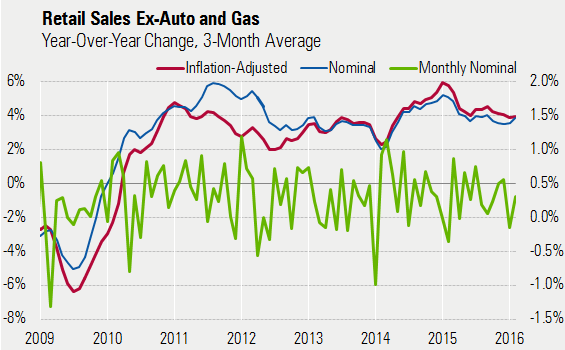
We suggest that readers instead focus on year-over-year, averaged growth rates, which have shown more persistence. Inflation-adjusted retail sales, excluding autos and gasoline, have bounced around a 4% annual growth rate since mid-2014, and even further back to 2012, ignoring the 2014 weather-related blip down (and the echo boom in early 2015). The upper lines represent annual, averaged retail sales growth rates and are read off the left-hand scale. The lower line and the right-hand scale show just how volatile and worthless the monthly data, in isolation, can be. We think, as usual, that retail sales continue to plod along, no boom and no bust.
Source: Census Bureau, Morningstar calculations
New Home Construction Indicators Remain Healthy A combination of data this week suggests the new housing market remains healthy, though not necessarily accelerating much. Builder sentiment remains at healthy, though not accelerating, levels. Housing starts got a nice month, but that is possibly one-time-only; permits, though softer, were still indicative of near-double-digit growth in starts in 2016.
Recall that new home construction--with the best improvements in single-family construction--and remodeling will be the key drivers of residential investment in 2016. Existing homes, which will be reported next week, are likely to show only very modest growth (3%-5%) as low inventories and higher prices continue to limit sales growth of used homes.
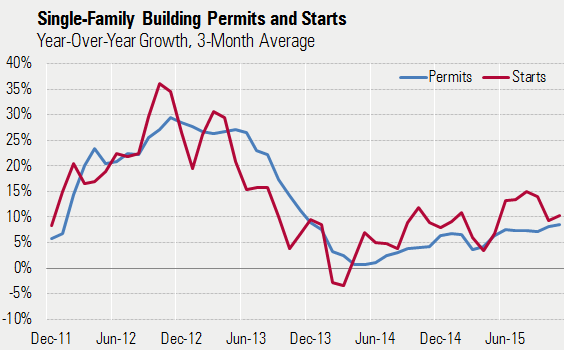
Given this backdrop, housing data this week supported our general thesis on improving new home construction. Housing starts looked particularly strong, increasing 5.2% to 1.18 million units on a seasonally adjusted, annualized basis. That was above market expectations of 1.15 million units. Within the starts category, single-family starts did particularly well, increasing 7.2% month to month. That represents an 822,000 rate, the highest rate since 2007. However, the sudden jump might be a little hard to believe, so we would look for some backing and filling (or an outright revision) in the months ahead. The gap between starts and permits is a little larger than we would like to see. Nevertheless, the single-family permits growth rate continues to edge higher.
Source: Census Bureau, Morningstar calculations
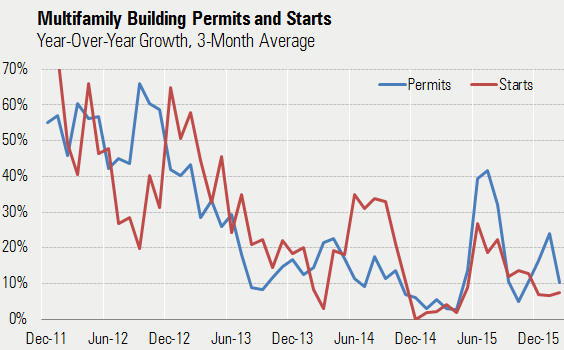
Still, if we scale that back, it appears that the single-family growth story will become a bigger part of the 2016 growth story as apartment starts seem destined to slow a bit as new units started earlier come on line. It's a little harder to see trends in the multifamily data because of the monthly volatility. Still, the growth trend has generally been down over the past year or two, and current apartment growth rates are already lower than the single-family rate.
Source: Census Bureau, Morningstar calculations
The raw number of apartment starts is near an all-time high, while single-family homes started are at less than half of their all-time highs. This would seem to suggest more potential in the single-family market, too. An improving single-family market tends to have a greater economic impact than a strong apartment building market because of higher prices, labor content, and square footage.
Source: Census Bureau, Morningstar calculations
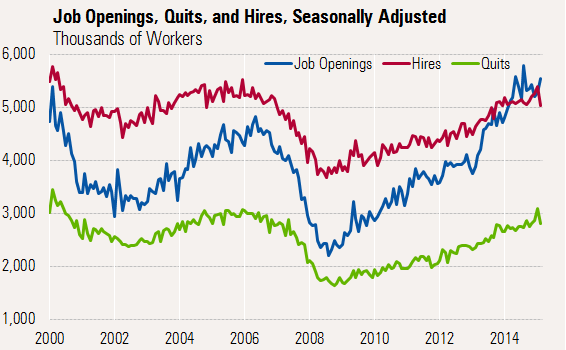
JOLTS Data Shows Many High-Paying Industries Are Still Hiring (by Roland Czerniawski) The Bureau of Labor Statistics published the latest Job Openings and Labor Turnover Survey, showing that job openings and hiring remained strong in January. Openings climbed to 5.5 million, a six-month high, after December data was revised down by 0.3 million (normal monthly revisions, plus new benchmark revisions back to 2001). The new hires metric edged down to 5.0 million in January from 5.4 million in December.
Source: Bureau of Labor Statistics
While the decline in new hires might seem troublesome on the surface, it is more likely a reflection of labor shortages (and longer hiring cycles, to a lesser degree) that continue to press on industries and professions offering high-paying positions. We've talked about building labor shortages for a couple of years. However, some hourly wage data suggests that those shortages haven't necessarily led to higher wage rates, especially on a monthly basis.
One of the most popular media explanations suggests that our recovery continues to be fragile because of the high concentration of employment growth within low-paying industries. The second narrative, which builds upon the first one, is that such a concentration depresses the hourly wage growth, suggesting that the employment growth is not benefiting the economy as much as the overall payroll data seems to be indicating.
It remains quite difficult to validate or invalidate either of those narratives, though the JOLTS data provides some additional context. Based on the report and the openings rate by industry (openings divided by employment plus openings), the top hiring industries are (and have been for a while): professional and business services, healthcare, hotels and restaurants, and finance. All of these categories tend to offer high-paying jobs, with the exception of hotels and restaurants. The table below summarizes this data.
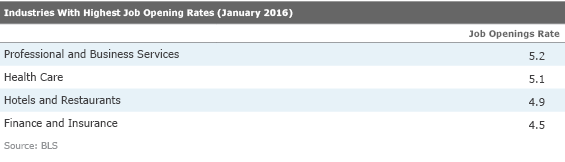
This shows that demand for high-paying jobs that require skilled labor is still very much intact. Now, if we compare this data to see if those job openings are actually being filled, the picture looks dramatically different.
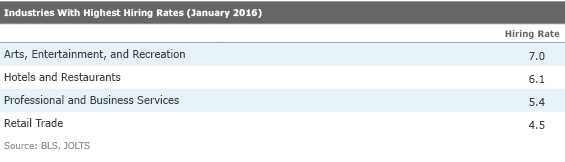
Based on the table above, it becomes clear that the industries where the hiring pace is the highest tend to offer lower-paying jobs. So what does this dichotomy tell us about the economy? First, it means that the labor market is still very much in need of skilled, high-paid labor. In a way, this is representative of continued strength in the U.S. economy.
So why are so many jobs being filled only in those lower-paying positions (with the exception of professional and business services)? In our view, there is a mismatch of skills required for many of those higher-paying job openings, and skills that prospective workers actually possess. This recovery has been seven years in the making, and the great majority of the skilled labor has already been rehired since the labor market bottomed. What the openings and employment data tells us is that hiring in the high-paying industries has not kept up with the employers' demand because of the lack of available skilled labor. In such an economy, it is not surprising to see that companies in those lower-paying industries that typically require few skills are able to find candidates much faster than their peers in healthcare or finance.
Given this environment, the mix of hiring industries may put downward pressure on wage growth in the short term. After all, a large portion of new hiring happens in areas where wages are and have been low for a while now. In the longer run, however, the apparent labor shortages in higher-paying industries will eventually begin pushing the overall wage growth higher, especially as this recovery ages, baby boomer retirements accelerate, and the low availability of skilled labor will force many companies to revise their wages to attract talent, adopt more internal training programs, or invest in more labor-saving devices.
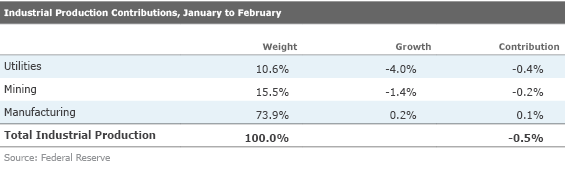
Manufacturing Continues to Hold Up Well The headline industrial production numbers were down 0.5% in February, prompting another flood of worried comments and awful headlines. Some posited that the hopeful signs of a January stabilization disappeared in February. The same worrywarts noted that headline industrial production was down four of the past five months. Well, that is true if you include utilities (which are suffering from warm-weather blues) and a renewed slump in the oil patch that's driving down the mining sector. Manufacturing counts for about three quarters of all industrial production, as shown below. Unfortunately, big swings in the other two categories can mask a stabilizing manufacturing sector.
The manufacturing sector managed to grow 0.2% in February following a 0.5% increase in January. On a year-over-year, single-month basis, industrial production was up 1.8%, better than full-year 2015 growth of 1% and the long-term average of about 2.5%. The bottoming of the manufacturing sector even shows up in the harder to influence three-month, moving average that shows 1.2% year-over-year growth, as shown below.
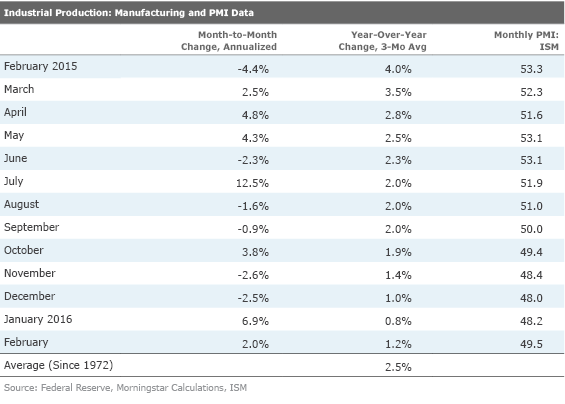
The purchasing managers' surveys, shown in the far right column above, also appear to have begun to improve. Also giving us some confidence is that a number of industrial production categories did quite well in February. The performance of the top 10 manufacturing categories is shown below.
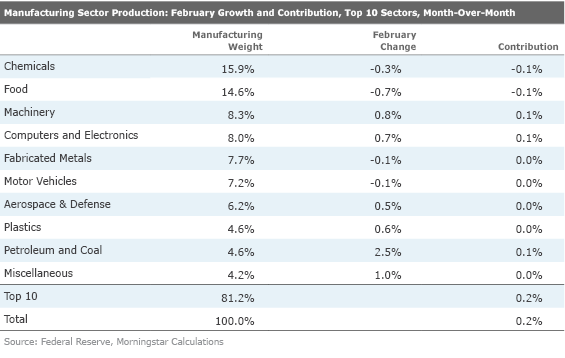
We wouldn't read too much into the slowing chemical and food sectors, as February's weakness followed sequential growth of about 1% in December. However, the report may be the start of relatively slower growth in auto manufacturing. This comparatively large sector grew about 8% last year, a bit higher than industry unit sales growth of 6% or so for all of 2015. This year, auto sales growth rates are expected to drop to 2%-3%, which could pressure auto production rates, which will in turn create a headwind for the manufacturing sector. We believe better growth in chemicals, food, and computers will more than offset auto industry plateauing during the course of 2016. Although one month doesn't make a trend, the large increase in machinery production in February suggests that the machinery sector will do better than the hefty 4%-5% year-over-year declines that we witnessed at the end of 2015. A stabilizing U.S. dollar may also take some pressure off of the manufacturing sector in 2016.
Just Housing and Manufacturing Data on Next Week's Holiday-Shortened Docket Next week brings both durable goods orders and Markit's Flash versions of its March PMI data for many countries. However, these reports have lost some relevance as China is one of those countries no longer reporting flash data. Still, it will be interesting to see how Europe is faring, especially with weaker trade conditions generally. We aren't fans of Markit's U.S. data, but it will be interesting to see if the Markit data begins to show an improving trend in March, as the ISM data showed trend improvement in January and February while the Markit U.S. Index registered a decline in February.
As usual, volatile airliner orders will muddle the durable goods report. Widely available data from
Like just about everyone else, we are expecting lackluster existing-home sales of 5.3 million units following an unusually strong January (5.5 million units). In the latest report, pending home sales stumbled and the sequential growth rate fell to just under 3%, suggesting that existing-home sales should be down. On the other hand, new home sales had a disappointing January, and we are expecting a decent bounceback in February. With more plentiful inventory and a new focus on lower-priced homes, as well as the limited existing-home inventories, we don't expect new home sales to stay below 500,000 units for long. Expectations are for new home sales to increase from 494,000 in January to 523,000 units in February, modestly above the 2015 average of approximately 500,000. Both existing- and new home month-to-month sales are quite volatile, which new paperwork requirements beginning in October are reinforcing, creating mini booms and busts in the short-term data sets. Therefore, we wouldn't read much into the February reports, one of the slower months of the year anyway.

