
As World Slows, U.S. Economy Chugs Along
Auto sales and construction data this week suggest the U.S. economy has so far not been materially affected by international growth woes.

Note: Bob Johnson was traveling at the end of the week so he is not providing his normal weekly commentary on market performance. The usual economic commentary for events through Wednesday appears below. Roland Czerniawski provides his comments on Friday's jobs report in a video that readers can find here. Friday's U.S. trade report will be discussed in next week's column.
U.S. Auto Sales Continue Strong in February Before diving into the just-released February auto data, let's set some context by looking at annual sales rates.
Auto sales and production have been key contributors to U.S. economic growth during this recovery. That was especially true at the beginning of the recovery when the industry was rebounding from very dire levels. After the big bounce, annual growth has been relatively stable at 5%-7%, as shown below.
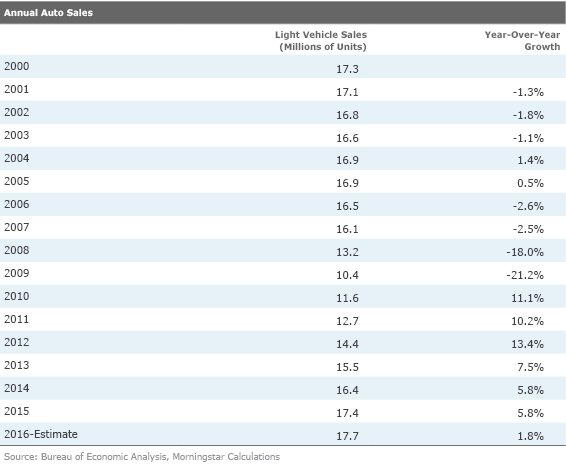
To be 100% honest, we expected a slowing growth rate in each of the past three years, and our estimates have proven too low. Even last year, we thought (along with a lot of industry pundits) that industry sales would top out at 17 million units in 2015, or just about 3% growth. The auto industry did a lot better than that, as you can see above.
Still, we are sticking with our slowing forecast in 2016. We do note that U.S. light-vehicle production has shown some of the slowing pattern that we anticipated. U.S.-based auto production was up just 3.4% in 2015 (versus total unit sales growth of almost 6% as imported cars have taken some unit market share gains). Somewhat offsetting that loss would be the fact that consumers continue to favor higher-priced vehicles, namely pickup trucks and SUVs. Average prices have been up 3% or so for the past three years, very little of that because of price increases. In other words, a mix shift to bigger vehicles is causing the auto sector to contribute more to GDP growth than one might suspect, just looking at unit data.
All of this sets the stage for the February new-vehicle sales report that was released this week. At first blush, the unit sales of 17.5 million units in February didn't look terribly exciting as they were roughly flat with January levels and not that far above December's report.
However, compared with the same month a year ago, which removes some of the seasonal mumbo jumbo, growth was a very healthy 7.3%. However, we should caution that the weather wasn't so great last February so we might be seeing a little weather-related help.
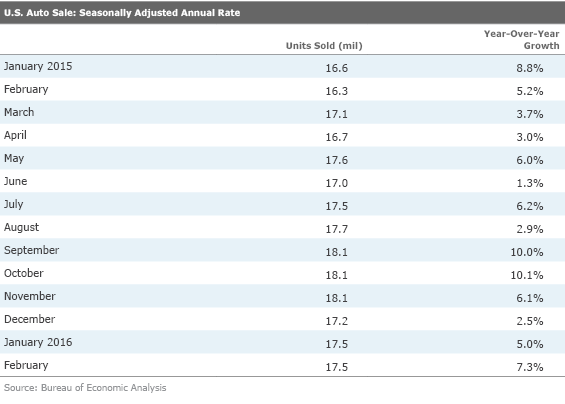
Still, one cannot ignore that sales have held up well over the past several months despite all the economic and market turmoil around the world. We have long thought that the U.S. economy would be one of the least affected by slowing world economies, and this month's auto data seems to back up our thesis. However, we still believe there will be little auto sales growth for the full year, but that has more to do with the aging of the auto recovery than consumers being spooked by the world economy.
Pending Home Sales Fall Because of Lack of Supply, Potentially Boosting New Home Construction In last week's column we did a full review of the GDP real estate investment category and the changing of the guard that was likely in 2016. We highlighted that the sector is likely to grow at a similar rate as 2016 with no real acceleration or deceleration. We also said it would be likely that lower-priced homes would fare better than high-priced homes, as the cohort of first-time buyers continues to expand. The apartment market was likely to show much slower growth, as many recent projects are near completion and as aging millennials show more interest in single-family homes. Finally, we warned that 2016 would likely be a difficult year for existing-home sales because of higher prices and limited inventories. Therefore, last week's strong existing-home sales report for January came as a bit of a surprise.
This week's pending existing-home sales for January brought everyone's expectations back to earth. The pending homes sales for January will potentially show up as existing-home sales in February, providing us with a peek into the future. The pending home sales index fell from 108.7 in December to just 106 in January, a 2.5% decline, which was above recently raised consensus expectations. That reading was the lowest since January 2015, suggesting that existing-home sales are going nowhere fast. The year-over-year data, averaged over three months, looks slightly better, but still suggests very limited growth in the existing-home market.
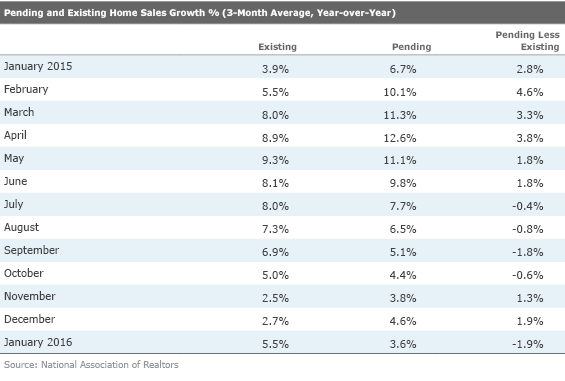
Also, pendings growth is running below closed-sales growth, suggesting that the existing-home market will continue to slow. This is nothing to panic over and is well-anticipated by the industry and our team here at Morningstar. The issue is lack of supply and not demand. This bodes well for new home construction, which is actually a bigger contributor to GDP than the commissions on the sales of existing homes.
U.S. ISM Manufacturing Data: A Bottom at Last Many of our readers may have noticed that we haven't spent much time on purchasing manager survey data lately. It used to be one of our favorite metrics. Purchasing manager data hasn't seemed to add much to our discussion of other manufacturing data. Those other data points include durable goods orders and the industrial production manufacturing data. We have spent the better part of the day trying to decipher and explain why the various actual data and the PMI data (and the indexes themselves) haven't really moved in the same direction or carried the same message.
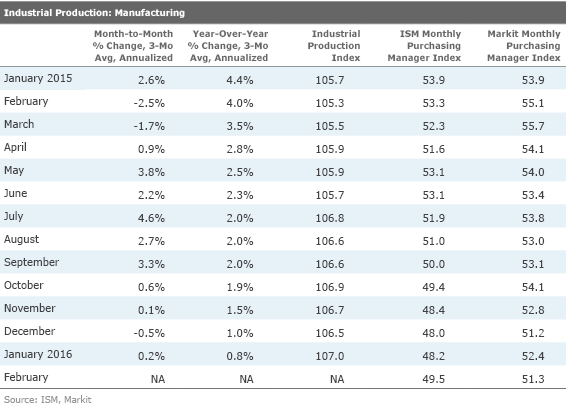
About the only conclusion we could easily make is that by just about every metric, the manufacturing sector isn't moving up or down. Since June, the raw IP manufacturing index hasn't really moved in either direction on a statistically significant basis; it has spent about seven months stuck between 106.5 and 107. With all those breathless headlines about a strong dollar, slumping exports, and a crummy world economy, the lack of an outright decline in the manufacturing sector is surprising. Month-to-month growth in IP, even when annualized, is barely moving.
Year-over-year data looks slightly better, with year-over-year growth likely to bottom at January's 0.8% growth rate. The ISM PMI index is just slightly on the slowing side, below 50, and the Markit data is slightly more on the expansion side, above 50, so I guess it shouldn't come as a surprise that manufacturing isn't growing, year over year or month to month.
What's clear, at least recently, is that the real-world data is moving faster than the supposedly more predictive PMI data, whatever the source. Note from January 2015 both PMI measures fell sharply from the mid-50s to the high 40s and low 50s. With that sharp fall we find it is a bit surprising that manufacturing, as measured by the Industrial Production Index, has actually moved up by more than 1% since January of a year ago--though we guess purchasing managers were right when considering the decline in year-over-year growth rates. That growth rate has fallen from over 4% to less than 1% (compared with long-term averages of almost 2.5% growth).
Monthly Data From ISM Did Have a Nice Bounce in February The ISM data did look better in January and February for the U.S. (we aren't fans of the Markit U.S. data), with the single-month average leaping from 48.2 to 49.5 in February. The key metrics of output and orders were both above 50. Employment, while still below 50, made a huge improvement. Faster supplier deliveries (which reduce the index because faster deliveries might indicate a lack of business) fell below 50, holding back the overall index. Inventories were also below 50, but again, much improved from the prior month. Although not included in the composite indexes, both the export and import order results were down and below 50. That is particularly bad news for our big importers into the United States. It also means that U.S. producers will be more dependent on domestic demand for growth.
Besides the sharp improvement in the single sequential month-to-month composite reading, there was other good news in the ISM report. Half, or nine, of 18 industry segments were in growth mode, indicating individual readings above 50. The most leading indicator, new orders, remained at 51.5, which should eventually drive up the composite in the months ahead. Twelve of 18 industries showed readings above 50, indicating some relatively powerful breadth. And the ISM dutifully reported that the current composite reading of the PMI was consistent with GDP growth of 1.8%-2%, just modestly below our 2.0%-2.5% forecast for 2016.
We also believed that the comments section of the ISM report sounded more favorable than the index levels. We are publishing those comments below in their entirety; no cherry-picking on our part.
What Respondents Are Saying
- "Low oil prices and reduced activity continue affecting our business." (Petroleum & Coal Products)
- "U.S. business demand is solid; international demand is soft." (Chemical Products)
- "Mobility spend is up." (Computer & Electronic Products)
- "Business has to get better. And it appears it is. Healthy backlog for 2016." (Fabricated Metal Products)
- "Very strong demand for product. Material availability very good and commodity pricing continues to be depressed." (Machinery)
- "Airlines are still ordering planes and spare parts for plane galleys." (Transportation Equipment)
- "Market is beginning to trend up with spring season on its way." (Wood Products)
- "Not seeing impact from global economic volatility or oil prices. Business is strong and growth projections remain the same." (Miscellaneous Manufacturing)
- "Orders are coming in stronger than expected." (Furniture & Related Products)
- "Still a bit sluggish." (Food, Beverage & Tobacco Products)
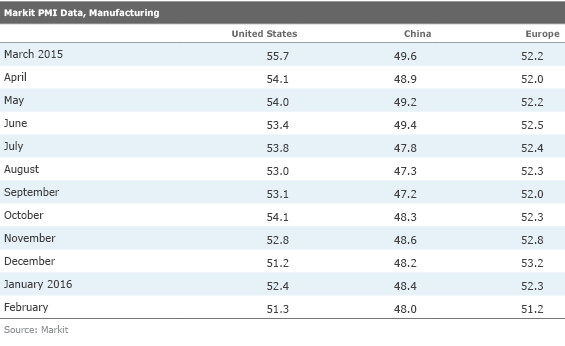
World PMI From Markit Didn't Look as Good The Markit data from China, Europe, and the U.S. (discussed above) didn't look nearly as good as the ISM data, and the tone of the releases seemed relatively weak. China still appears to be bumping along the bottom with no clear trend, but a poor absolute reading. Unfortunately, China is registering the worst level, and it is the most dependent on the manufacturing/construction sector (42% of GDP).
Europe is much less dependent on these sectors at 24% of GDP, and the U.S. is even less at 18%, according to 2014 data from the European Central Bank. We don't think either the U.S. or the Chinese data was terribly troubling or really new. Europe, on the other hand, seems to be losing some of its momentum after the new QE programs last fall.
Almost all European markets were above 50. Still, almost every country showed deterioration from the previous month. The worst of the slowing appeared to be in the largest country in the EU, Germany. Its PMI reading fell from 52.3 to 50.5. The only silver lining for Germany was that the result was slightly above the earlier flash reading, and now Germany's reading is above France's (50.3). However, Germany still ranked below the other reporting European countries excluding France and Greece. Not exactly great company. Germany is at least partially being hit by weaker world trade, as it remains as one of the world's most export-dependent economies. Germany and France are the number-one and number-two largest economies in Europe, so they do weigh on the headline data.
Construction Data Looks Surprisingly Strong We don't spend a lot of time analyzing the monthly construction report because it comes so late in the cycle (we got the January data on March 1). The data is frequently revised (there were some big positive adjustments to past months in the most recent release), and a lot of the data (starts and permits) is available elsewhere.
Still, we couldn't help but notice that the January data showed a huge month-to-month gain of 1.5%, well above expectations of just 0.5% growth. The previously lethargic public sector, which sequentially gained 4.5% in a single month, led the growth. This bolsters our case that government spending will boost GDP growth in 2016. Also, private-sector spending was up a healthy 0.5%. Looking to year-over-year data, January over January, public-sector construction was up 13.5%, and private spending was up 9.0%. The private-sector gains were broad-based. However, nonhousing-related data was much stronger than the housing market. The office market has been particularly strong, growing over 30% year over year while commercial space (including retail) has shown little or no growth.
Next Week Brings Very Limited Data The second week of the month is normally quiet, but next week will be even slower than usual. The normally released job openings report falls in the third week of the month this time around. That leaves us with just the Small Business Sentiment report from the NFIB and the Monthly Treasury Report. The business sentiment report will give us some feel for how small-business owners are holding up given all the financial turmoil and worker shortages. The Treasury report should begin to show some signs of the budget deal signed in December that will likely widen the deficit some.
/cloudfront-us-east-1.images.arcpublishing.com/morningstar/54RIEB5NTVG73FNGCTH6TGQMWU.png)
/cloudfront-us-east-1.images.arcpublishing.com/morningstar/ZYJVMA34ANHZZDT5KOPPUVFLPE.png)
/cloudfront-us-east-1.images.arcpublishing.com/morningstar/MNPB4CP64NCNLA3MTELE3ISLRY.jpg)