
Inflation Shocker May Force the Fed's Hand
If the Fed stands true to its word, it really does need to act now based on this week's surprising PCE inflation data.

World equity markets diverged a bit this week, with emerging markets led by China. Emerging-markets indexes were down about 0.5%, as was Europe, while U.S. markets were up about 1.5%. Stabilizing oil prices, fewer recession worries because of stronger U.S. economic data, and the winding down of a lackluster earnings season as well as tired sellers could all be explanations for the stronger U.S. results.
While the single-week U.S. data was nothing special, it follows a week of more than 3% price appreciation. Over the period, U.S. stocks are up over 5%, the best two-week run of 2016. That is up about 4% from the Feb. 11 low. Commodities also did well, gaining 1.2% for the week, the second-place performance rank for the week.
Surprising inflation data embedded in the January consumption report, along with the inflation revision for the fourth quarter, helped to push bond prices down sharply on Friday, though for the full week the U.S. 10-year bond rate increased just modestly from 1.75% to 1.76%. Dovish statements from a couple of Fed governors early in the week helped calm the bond market. Apparently they didn't get the memo about an improved U.S. economy and the accelerating inflation rate lurking in the background.
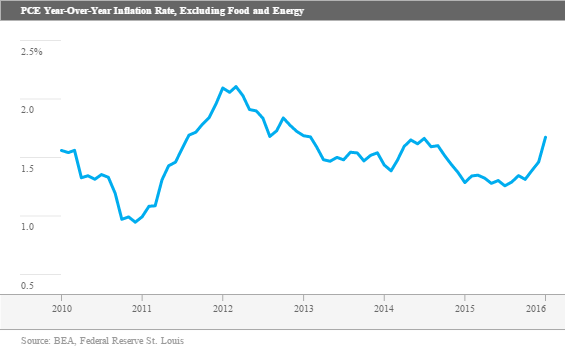
We think the bond market calm may be short-lived. As we discuss in our inflation outlook below, some revisions to past data and new January data showed that inflation, when measured in the Fed's favored core Personal Consumption Expenditure metric, accelerated sharply to a 1.7% year-over-year rate, painfully close to the Fed's target of 2%. Labor markets, the second key metric in setting Fed policy, already look relatively strong and stable. A strong labor market report next Friday could really end up forcing the Fed's hand. Even if the Fed doesn't act, we believe markets will, pushing up interest rates that are outside of the Fed's control. In the coming months, Fed actions will tell if the economy, labor markets, and inflation are really the Fed's key indicators, or is it really just trying to keep equity markets going up? There was a wonderful quote in this morning's New York Times asking which the Fed should believe: its Bloomberg terminal or its FRED database?
This is a reference to Bloomberg's financial and stock market data, which has looked horrible, versus hard economic data from FRED. Recent economic data from FRED shows the real economy has looked surprisingly strong. Slumping December and fourth-quarter data proved to be a weather-related blip that disappeared in the January data. Stronger data just this week included existing-home sales at the second-highest monthly level of the recovery, continued strong home price appreciation (which is probably more important to consumer pocketbooks than the stock market) and sharply higher January income, and now even consumption numbers. Even durable goods orders looked surprisingly strong, again proving the manufacturing sector is not going down the drain just because the dollar is strong and the oil industry is feeling some pain. So whom to believe, the markets or the economy? It's a conundrum explained quite well in The New York Times article. Having worked as both a stock analyst following technology stocks and as an economist, I certainly don't see a clear-cut winner and will leave it for you, the reader, to decide.
Higher Core PCE Inflation May Have Been the Biggest Surprise of the Week Core PCE inflation jumped 0.3% from December to January, well ahead of estimates of a 0.1% increase. More important, the year-over-year, single-month growth rate jumped to 1.7%. This is the key inflation metric that the Fed claims to be watching (not the CPI). This measure, because of different weights and methodologies, has been running well below Core CPI inflation for some. This month the two converged with a vengeance.
So what's the big deal? Well, the Fed's inflation goal is 2% on this very metric. And it had previously indicated that it is likely to act before this metric actually hit 2%, as by then it might be too late. If the Fed stands true to its word, keying off economic data--especially inflation and labor markets--it really does need to act now.
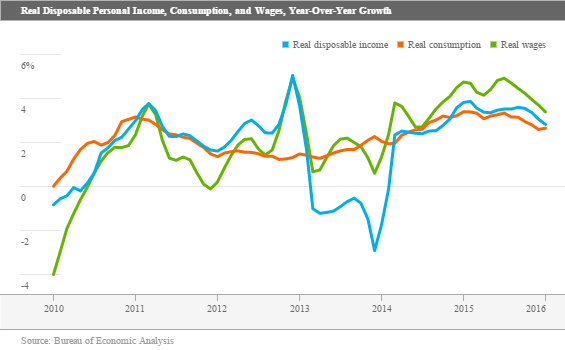
Income and Consumption Show Nice Monthly Trend; Year-Over-Year Data Come Back to Earth Headline month-to-month income and now consumption showed very healthy improvement, as we have suspected for some time. Month-to-month incomes and consumption both increased 0.5% in nominal terms (more than 6% annualized) and 0.4% (4.8% annualized). This would seem to finally deflate the notion that consumers have been afraid to spend their increased earnings and gasoline savings. Most of the data was higher than expected, even the PCE inflation number. The improved data should come as no surprise to our readers, as we have warned that weather and auto anomalies had artificially deflated some of the numbers late in 2015. All it took was for weather to improve to produce a blip in the other direction. And we certainly got that blip in January.
The year-over-year data isn't quite as unambiguously positive. Growth rates in real disposable incomes, wages, and consumption have all slowed from their heady growth rates of late 2014 and early 2015. Those rates were inflated by an unusual confluence of events: deflation and improved economic data in the middle of crucial budgeting and year-end spending and hiring decisions, which caused an almost-yearlong spike in both income and expenditures data. Now those growth rates have returned to the averages of most of the rest of the recovery. Therefore, we aren't really worried about the declining trend, unless it intensifies over the next three months. We suspect that wage, income, and consumption are likely to stabilize in the 2.0%-2.5% range for most of the rest of 2016, pressured a bit by rising inflation rates. Again, it is hard for any of these items to grow a lot faster than GDP growth, but they did, at least temporarily, in 2015.
Upward GDP Revision Has More to Do With Accounting Than Reality (By Roland Czerniawski) The revised fourth-quarter GDP released on Friday took the markets by surprise. The consensus expectation was for a further downward revision from the initially reported 0.7% to 0.4%. Instead, the newly estimated real GDP growth was increased to 1.0%.
At first glance, it appeared that a modestly downward revised goods consumption and lower state and local government spending were more than offset by a larger increase in private inventories and lower-than-initially estimated goods imports. The slight downward revision to consumption would be somewhat troubling, if it weren't for the fact that January's consumption data looked very good, as described above. Too, the consumption revisions were largely in already known problematic areas, many weather-related (gasoline, energy, clothing, and autos). If everything continues at the current pace, a rebound in first-quarter consumption is highly likely.
Second, the upward revisions to inventories and trade data might be nothing more than just quirks in the accounting methods. Inventories were adjusted upward because of changes in inventory valuation adjustment, or IVA, which BEA describes as the difference between the historical costs at which businesses value their inventories and current costs. IVA adjustments are just another one of those truly necessary but extremely difficult to calculate factors that make inventory data relatively worthless in the short run. (Actual physical count issues, shifting seasonal factors, and inflation adjustments are just a few of the other confounding factors.) As a result of primarily the IVA adjustment, the change in private inventories contributed negative 0.14% to the fourth-quarter GDP, compared with the previously estimated negative 0.45%. Changes in inventories tend to be a zero-sum game, at least over full-year periods. Consequently, Friday's GDP inventory adjustment most likely means that the first-quarter inventory rebound is now going to be smaller.
Finally, the lower-than-expected imports of goods came as a result of another accounting quirk. According to BEA technical notes, the downward revision of goods imports was primarily due to territorial adjustments related to how Puerto Rico and other U.S. territories are accounted for. Most of our trade partners count Puerto Rico in the U.S. data, but BEA strips that data out when it becomes available. This time, the additional data became available between the two GDP revisions.
Overall, the upward fourth-quarter GDP revision is not a game changer, and does not alter the big picture of the overall U.S. economy. Fourth-quarter growth was muted, and at least some of the "slowdown" can be attributed to faulty seasonal factors and unusual weather patterns. We now know that economic activity has picked up meaningfully so far in the first quarter, and a moderate rebound in GDP growth still appears to be in the cards for the first quarter. A forecasting tool from the Atlanta Fed estimates that first-quarter real GDP growth now stands at about 2.1%, which is in line with, to slightly below, our estimate of 2.0%-2.5%.
Real Estate Investment Primed for Another Decent Year, Driven by Remodeling and Single-Family Home Construction We have always contended that residential real estate has been a very important part of this overall recovery. On average, residential investment has represented about 5% of GDP ranging from as low as 2.4% during the most recent recession to as high as 6.6% in 2006. Currently, it is running at 3.4%, suggesting the housing market has more room in front of it and is not nearing an end-of-cycle period of decline. It may never make it to the previous high of 6.6% of GDP because of demographics and slower population growth. However, we believe that it easily could surpass the long-term average of 4.7%. Although this may seem like a small number, it is growing faster than GDP, causing it to make an outsize contribution to growth. Notice the last line of the table below. Over the past four years, almost 12% of GDP growth has been due to housing.
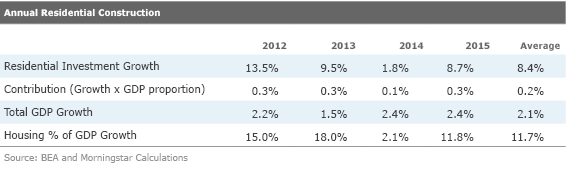
And that is just from the very direct impact of new home construction, remodeling of existing homes, and commissions on the sales of existing homes. That does not include all the inspectors, furniture, mortgage brokers, and movers that typically follow new and/or existing-home sales, which could conceivably double the relative importance of the housing sector.
In terms of relative importance, a very rough approximation is that new home construction is about half of the residential investment, and commissions on existing homes and remodeling each represent another quarter of the total spending. Permits and starts data that were released and discussed last week are the best way to get a feel for the new home component. We mentioned last week that permits have been trending in the 7%-9% unit growth range, which would be relatively similar to the growth rate in 2015. There is certainly some upside potential in our forecast of 1.2 million starts (versus 1.25 million for the consensus), but the short-term data doesn't yet support the higher level of growth, in our opinion. We also noted the single-family units (versus multifamily homes and apartments) have an outsize impact on construction dollar data because single-family homes are far more expensive to build and more labor-intensive, to boot. We are expecting minimal apartment growth in 2016 and an acceleration of single-family home growth.
This week's new home report looks at a relatively narrower set of homes, just single-family homes, primarily built in medium to large developments (but excludes one-off custom homes). However, this report also includes homes not yet started in addition to the sale of partially and fully built homes. Therefore, it can give us a little insight into starts and permits data, even if it is not as complete as other reports.
This January's new home sales report was its normal squirrelly self, surprising everyone with a 9.2% sequential drop following an almost-offsetting 8% jump in December. Part of the big 8% jump was related to clearing out some of the backlog of paperwork created by new regulations. So in our minds, the 494,000 homes sold (on an annualized, seasonally adjusted basis) represent a return to normal. Sales for all of 2015 were 501,000 units, an increase of 15% for the full year. I am including our usual year-over-year data for a sense of completeness, but because of continuing volatility issues it is not particularly enlightening.
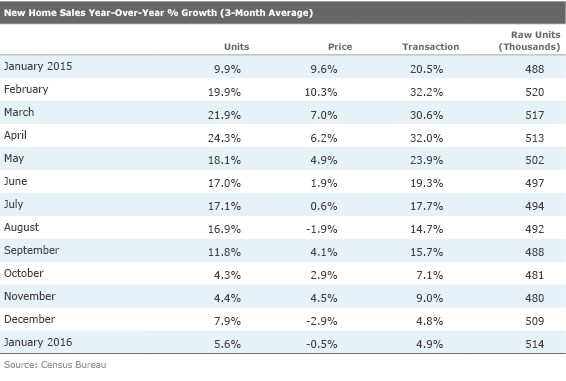
It is hard to see much more than stabilization in recent growth rates. There is, however, some hope for getting back to last year's 15% growth rate in new home sales. First, January (and February) sales rates are about half as influential on the full-year data as some of the spring and early summer rates. Furthermore, builders seem to be getting more responsive to customers' desire for lower-priced homes. While general home prices have been going up around 6%, the past couple of months have seen a decline in the price of a new home, as shown above. That is good news for frugal buyers. Third, inventories of new homes are creeping higher. Supplies of building sites have been tight, limiting the number of units could be sold. Without inventories to sell, sales are lost to the existing-home market or purchases are delayed.
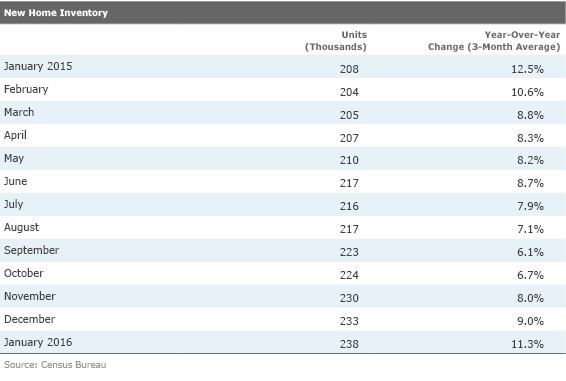
If inventories are a proxy for short-term growth potential, then it looks like recent inventory growth portends new home sales growth of 11% or more. Meanwhile, as we shall discuss shortly, inventories of existing homes are near recovery lows, suggesting less competition from the existing-homes market. Finally, unstarted homes, which will benefit both starts and GDP data in the months ahead, now comprise 31% of new homes versus 27% a year ago.
The Existing-Home Market, Which Was Supposed to Perform Poorly, Looks to Be Doing Fine Low inventories, high prices, and not great pending home data had many expecting a rotten year for existing-home sales in 2016 (new homes were expected to carry the ball for residential investment in 2016). Even the normally cheery Realtors association thought sales would be lucky to increase from 5.26 million units in 2015 to a range of 5.4 million-5.5 million units or just 4%. Homebuilders, which one might expect to be a little pessimistic on existing-home sales, thought sales of new single-family homes would show no growth at all in 2016.
So everyone was surprised when January annualized sales jumped to 5.47 million units, from already high 5.45 million units the prior month. The consensus estimate was for just 5.3 million units. The year-over-year data looked good too, up 11% for the single month of January. Warm weather in the Midwest and the Northeast boosted sales there, perhaps artificially driving up sales about 19% and 20%, respectively, on that single month, year-over-year basis. The three-month averaged data, in the fourth column below, shows 5% growth, which seems more in line with our full-year expectations. Still, the January pop was a nice surprise and will boost other economic data in the months ahead.
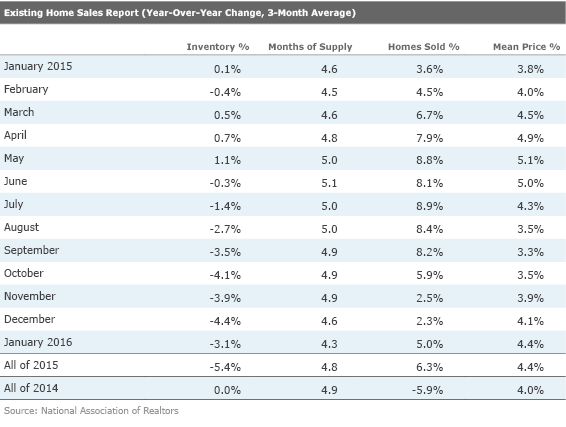
The table above also includes a few other interesting features. For some perspective, we showed the full-year results for both 2014 and 2015. The most worrisome existing-homes data in terms of future results is the continuing low level of inventories. Inventories shrank for all of 2015 and are down 3% on our three-month moving average basis from a year ago. At 4.3 months of supply, current inventory levels are getting painfully close to the low bound of four to six months of supply that is considered to be healthy. Worse, in some hot individual markets, supplies are approaching just two months.
Just like brick-and-mortar retailers without goods on the shelves, it is impossible to boost sales without inventory. It also explains the unusually strong price action in the housing market. (More on that in just a bit.) Low inventories have the National Association of Realtors openly fretting about the all-important spring selling season. However, we do note they were almost as panicked last January, and 2015 turned out relatively well.
We suppose that maybe the inventory data might not be quite as bad as it looks, because more supply is coming on the market, it is just being snapped up more quickly. Homes clearly are spending less time on the market before they sell, so low inventories might support more sales. That could be just a bit of wishful thinking on our part. The silver lining of the low existing-home inventory levels is that it might encourage more people to consider new homes where supply is better. Indeed, that is why we are more optimistic about housing starts and permits in 2016. Remember, the impact of a new home sale on the economy is far greater than the sale of an existing home, so that is also not entirely bad news. However, we are at least a little worried that some of that new home inventory may not be located near some of the really hot residential markets.
Home Remodeling Growing at a Healthy Rate
Remodeling is an often-forgotten, not as volatile piece of the residential housing market. However, in the most recent fourth quarter, it did comprise 31% of residential spending and grew about 12% compared with a year ago. Remodeling grew faster at about 12% fourth quarter over fourth quarter, even faster than new home sales, which grew 11%. We won't analyze this important category this week, but we do expect continued improvement in the remodeling category for the year ahead. As loans continue to become more available and consumers are more confident in their home values, we expect to see continued healthy growth. With low inventories of attractively priced homes, we believe many people will be forced into considering remodeling. Recent sales data from
Home Prices Continue Their Brisk Assent
Home prices continue on a roll and the FHFA, Case Shiller, and
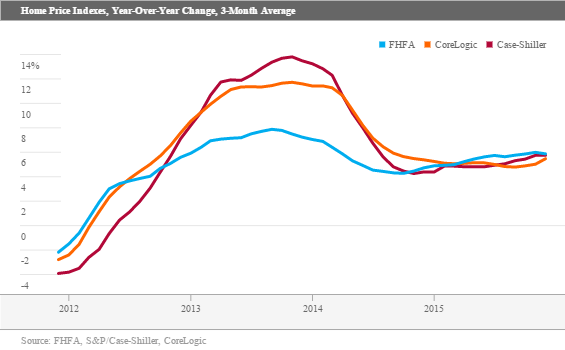
Looking at FHFA monthly data for December, released just this week, monthly prices were up 0.4%, which annualizes to about 4.8%. That rate is lower than the December-to-December rate of 5.7%, suggesting that price growth may be moving into a stabilization phase. The low inventory data we discussed above seems to suggest the respite might be short-lived, though.
Though on a breadth basis the housing market still looks strong with eight of nine markets up, ranging from negative 1.6% in the Mountain states (the Western states, ex the coastal regions, heretofore the strongest region) to 1.9% in the East South Central region (Alabama, Kentucky, Mississippi, and Tennessee, which had been laggards most of the recovery, are now in the most improved region for all of 2015). And for all of us worrywarts, Texas home prices in the December quarter were still up 1.6% sequentially in the fourth quarter, above the national average of 1.4% for the fourth quarter. However, price growth in December for the West South Central region (which is primarily Texas, but state-level data is not available monthly) was just 0.2%. That is well below what it has been running, but not a disaster given all that has happened to oil over the past year. Worries about Texas real estate are part of the reason that some economists think home prices may decelerate for the nation as a whole in 2016.
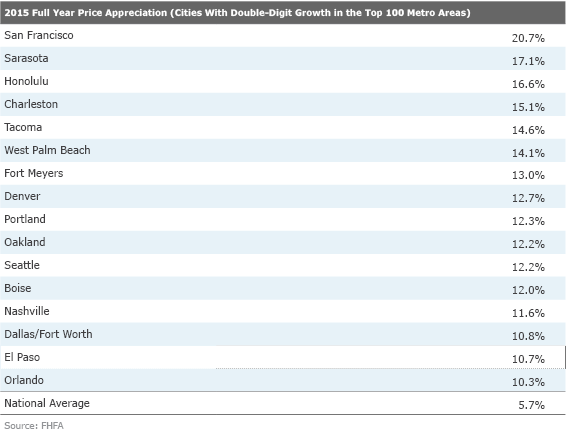
Still, while the national and most of the regional pricing data sets look benign, a lot of major markets are certainly looking a little frothy. Healthy employment growth and limited geographic expansion room may be justifying many of the increases. Below, we note the full-year growth rates for all of the metropolitan areas showing double-digit growth. Remember, the national growth rate was just 5.7%.
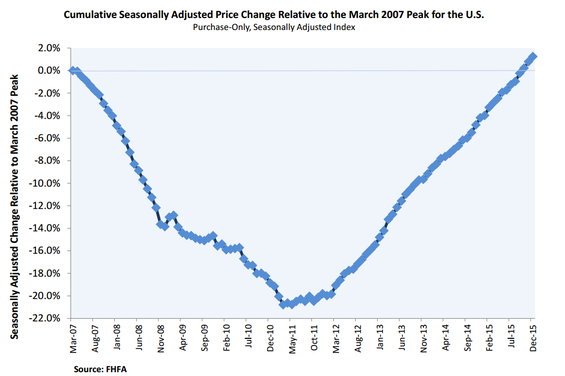
If we look at absolute levels of the price indexes, the less volatile FHFA index (which includes only homes with a government-insured loan) prices are now back above their March 2007 high, which was a bit of a surprise to us. At one point that index had been down over 20%.
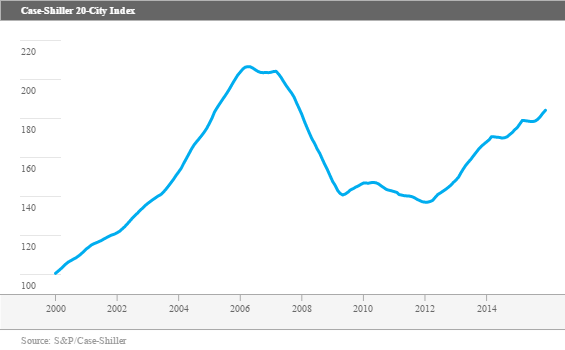
The more volatile and more geographically limited Case Shiller Index is still about 11% below its all-time high after being down as much as 33%.
Manufacturing Stabilization Continues, Though the News Is Not Quite as Positive as Monthly Headline Data Suggest The economic commentators were all generally very bullish on the recent durable goods orders report. One outlet noted durable goods total orders jumped 4.9% from December to January, the "biggest gain in 10 months." Even stripping out the volatile transportation sector, orders were up 1.8%. Longer-lasting capital goods, less defense and aircraft, also jumped a very healthy 3.9%, rebounding from and anomalous decline of 3.7% in December.
These are clearly good numbers and suggest that we have turned the corner. Every single category except "other" showed order growth, which is usually very good news when the breadth is this good. Lately we have been happy if half the categories are positive and half are negative. To top it off, many categories, including machinery, computers and communication equipment, and transportation equipment were all up more than 5%.
However, one month isn't enough time to draw many statistically valid conclusions. So many positive categories all in the same month seem to potentially suggest yet another case of faulty seasonal factors. And even if the data is 100% accurate, we often caution that big monthly jumps are often followed by months of flat data. Unfortunately, things don't grow in steady, straight lines.
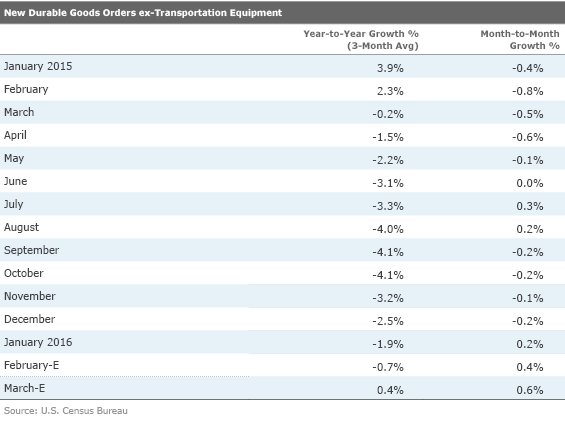
Year-Over-Year Durable Goods Order Data About to Turn Positive, but Not as Strong as Monthly Data The year-over-year data doesn't look as good because of lower inflation rates and comparisons against three very good months of orders in 2014 and early 2015 (before collapsing in the spring of 2015). In another month or two the year-over-year data should begin to accelerate sharply, even if the month-to-month data doesn't get much better. In fact, if orders are unchanged in February, the single month, year over year will move up 1.6%, its first potentially positive month since January 2015. Flat numbers for February and March will push our three-month moving average into positive territory one month later, namely March, which will be reported in April. (Note we aren't forecasting orders, just showing what happens if the single month growth rates are unchanged in February and March. The month to month column appears to show growth, but that is because it is a three-month moving average. We have inserted zero growth rates for the single months of February and March, which are not shown in the table.
Just a reminder, because durable goods orders and especially capital goods take so long to produce, orders received now will benefit the months ahead, making this one of the better leading economic indicators. This is another set of indicators in what is becoming an increasingly long list of improving manufacturing metrics, including ISM PMIs and industrial production. We strongly suspect the manufacturing sector will be a bigger contributor to growth in 2016 than it was in 2015.
Next Week on Tap: Employment, PMIs, Pendings, Autos, and Trade Data The most important indicator next week will be the employment report. The consensus calls for around 200,000 jobs added in February, up from 151,000 jobs added in January. January's report had a huge seasonal adjustment of nearly 3 million added jobs. The adjustment in February is not as large, making it a slightly more reliable month for forecasters. Given strong consumer and initial claims data, we think 200,000-210,000 jobs are a likely outcome.
Besides jobs data, wage growth will be important to watch. Another strong month of faster-than-expected wage growth coupled with strong payrolls data could be just what the Fed needs to proceed with an interest rate increase in March. On the other hand, if the February jobs report disappoints, the interest rate action could easily be postponed to the second quarter or later. It appears that markets are currently pricing the probability of the latter as the more likely outcome, but we've been warning our readers that a March rate hike is not off the table yet.
Manufacturing PMIs will be another set of important indicators. The U.S. PMIs from both Markit and ISM have been showing signs of weakness, but they should not be market-moving in the absence of a large swing in the data. What will have a tremendous market-moving ability is the Markit PMI from China. This number has been moving sideways for the past few months, making it difficult for investors to gauge the direction of the Chinese economy. The Chinese New Year celebrations could further complicate the interpretation of this figure and potentially stir unnecessary market volatility, especially in the absence of flash readings that were previously available on a monthly basis.
On the housing front, pending home sales will be released on Monday, giving us a glimpse into the state of the housing market. Existing new home sales did well in January, exceeding most expectations. Pending home sales are notoriously difficult to predict, and overall the growth has been moderating. Consensus calls for a 0.5% monthly increase in pending homes in January.
Motor vehicle sales levels are always a key gauge of consumer sentiment and are among our key economic metrics. Seasonal factors and selling day count issues have muddled a lot of the auto-related reports, creating confusion and volatility. Sales fell sharply in December from an artificially inflated 18.1 million units in November to 17.2 million units, ruining a lot of fourth-quarter data sets. Despite some nasty weather that shuttered dealerships in January, sales rebounded nicely in February to 17.5 million units. Economists are estimating a further improvement to a 17.7 million annualized pace in February. The trade rags are slightly less confident, estimating a still-healthy 17.5 million units. We note that last February was cold and snowy, depressing last year's results to just 16.5 million units.
The first run of trade data for January released this Friday is kind of useless because it is not inflation-adjusted and counts only goods and not services. That data will be released next Friday. An initial look at the January goods data suggests that the trade deficit widened slightly between January and December, opening the possibility that trade could be an issue in the first quarter. We will be able to have a more informed opinion on first-quarter real net exports after the fuller data set is released next Friday.
/cloudfront-us-east-1.images.arcpublishing.com/morningstar/F2S5UYTO5JG4FOO3S7LPAAIGO4.jpg)
/cloudfront-us-east-1.images.arcpublishing.com/morningstar/7TFN7NDQ5ZHI3PCISRCSC75K5U.png)
/cloudfront-us-east-1.images.arcpublishing.com/morningstar/QFQHXAHS7NCLFPIIBXZZZWXMXA.jpg)