
Deflation Hides the Growth in Consumer Spending
After deflation adjustments, the retail sales data was quite positive, at least for consumers.

We can actually say it was a good week for just about all markets, although they remained a lot more volatile than we all would like. Weekly equity returns ranged from 1.4% in the U.S. to 3.1% for emerging markets. Even commodities had a great week, with the broad index up 2.8%.
Oil had a massive rebound on Thursday and Friday, gaining almost 10% during those days. We couldn't see any potential catalysts, except oil had fallen too far and the sellers got tired of selling. While the oil news almost seemed bad to us, the market took great solace on finding a bottom, maybe. The best performers this week were the worst-performing items in the previous week. For 2016, the major U.S. equity markets have lost between 6% and 8%.
The Consumer Price Index was the most important item this week. Most of our weekly report focuses on the ramifications of a modestly deflationary report. Most all of the deflation remains on the goods and services side of the house, which the Federal Reserve can't really control through monetary policy. Services inflation continues to creep up, and it is now pushing a 3% rate year over year. Services account for 59% of the CPI, so that number remains a bit worrisome. And as we expected, after deflation adjustments, the retail sales data was quite positive, at least for consumers. For retailers, not so much.
The housing data included existing-home sales, and starts really didn't provide any new economic clues. Starts did just a little worse than hoped, and existing-home sales did considerably better than expectations in December. However, the year-over-year data was very consistent with past months, with starts firmly in the 8%-10% range and existing-home sales showing signs of dropping to 3%-5% for 2016. Housing will probably continue to contribute to GDP growth in 2016, but perhaps at a slightly lower rate than in 2015.
Falling Energy and Goods Deflation Drive December Headline Prices Down 0.1% As generally expected, consumer prices were down 0.1% in December, driven by a combination of energy, grocery prices, clothing, and even drugs. The number was generally in line with expectations, but the broad mix of declining categories and more deflation in Europe were worrisome to some.
First, let's step back and look at the year over year, average data as we always like to do to smooth out some of the monthly jiggles and those error-prone seasonal factors.
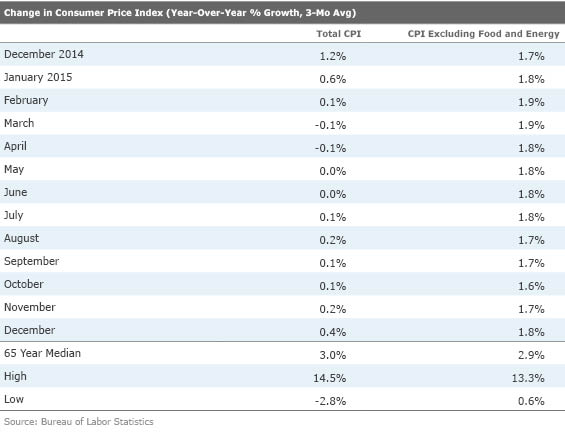
Here you can see that total inflation has been drifting up since midyear and since the recovery began but is still unusually lower than the long-term trend. From a consumer point of view, the total CPI is what we should be focusing on, not core, because food and energy are key components of consumer spending that cannot be easily evaded. The current numbers are unusually good and have helped move the consumer along (despite the headlines on stingy consumers).
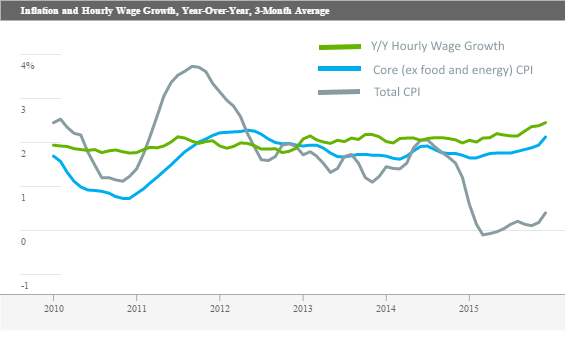
Core inflation has shown no particularly clear trend and some incredible stability. Businesses and government, and even some consumers, do most of their planning based on core figures, with some supposition that wild prices swings in food and energy often stabilize or reverse themselves over time. Workers and businesses are clearly focused on core inflation when setting hourly wage rates. The relationship between total inflation and wage growth is tenuous, while core inflation and hourly wage growth are more closely linked.
Source: Bureau of Labor Statistics
And from the Fed's perspective, food and energy prices can't be very directly controlled. They are world commodities influenced more by supply and demand, not Fed policy. That's at least part of the reason the Fed's policies focus on core inflation rates. So that is why it's important to look at both core and "all-in" inflation rates. Core is important for the Fed and long-term planners, while total inflation is important to consumer spending and the direction of the economy. A high total inflation rate is a great recession predictor, while core inflation has been a laggard and has even missed some recessions.
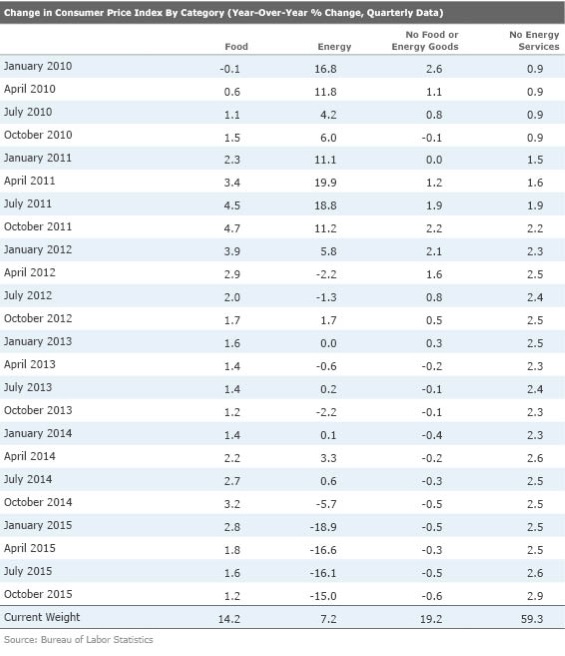
Category Data Indicates Inflation Maybe May Be Brewing As we have pointed out before, energy and food are currently deflating, reducing the inflation rate. Less known is that a strong dollar has helped sharply reduce the price of goods, which comprise almost 20% of the consumer price index. Those pressures are intensifying and broadly based. Paradoxically, if the Fed continues to push rates higher, likely making the dollar stronger, goods deflation may intensify, not exactly their intent. Nonenergy goods represent about 20% of the CPI.
However, inflation in the services category, which comprises 60% of the CPI is pushing 3% and likely to move higher in the months ahead as labor shortages continue to build. We expect services inflation to shine through in the months and years ahead, either through price stabilization or shrinking weights in the inflation calculation (energy's weight has already fallen to 7% from 10% since 2011). Therefore, energy's ability to hold back inflation in the years ahead will be more limited.
Assuming everything except services remained unchanged, headline inflation would approximate 1.8%. If inflation in everything except services was half the interim high reached in 2011, headline inflation would approach 2.4%. Of course, that assumes that services inflation stays at 3%, which is far from a certainty given tight labor markets. Recall that a 4% price increase is where we get very panicky and worry about a recession.
Good Inflation Data by Category Show Why Retailers Are Feeling the Heat Apparel, drugs, and groceries all saw price declines in December. These are key items that consumers buy in stores. Also, these are just the big categories.
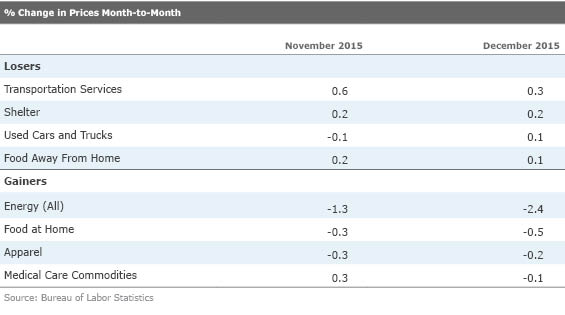
There just weren't too many goods-related categories that saw meaningful price increases--window and floor coverings were up 1.3% and jewelers were up 1.8%. It took a lot of digging to find those.
Maybe Last Week's December Retail Sales Report Wasn't So Bad After All Most observers deemed last week's retail sales somewhere between disappointing and disastrous as retail sales fell 0.1% even as the weather was good and consumers continued to pocket gasoline savings. We warned everyone to hold their powder until we could apply the CPI deflation rates, so we could make firmer conclusions. Lo and behold, using some crude measures, it appears that instead of falling 0.1%, sales gained 0.3% when adjusted for inflation. That follows a 0.7% gain in November and what we guess would be little change in October.
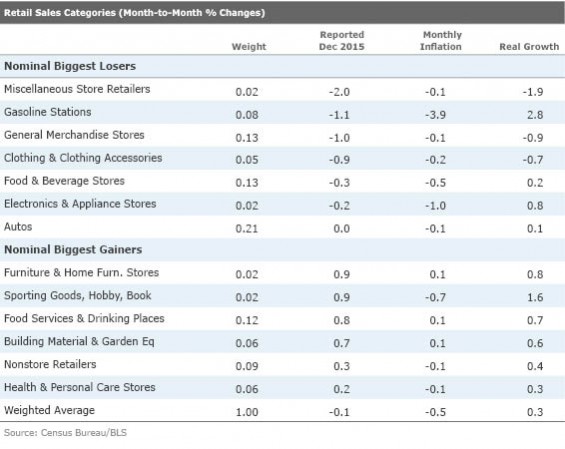
Remember, the inflation-adjusted retail sales number is weighed down by the lack of cold weather gear, too. So the report wasn't and still isn't a concern for us. In fact, as winter hits back with a vengeance in January, retail sales could do better as cold-weather items finally sell. That is, if consumers can get to the store.
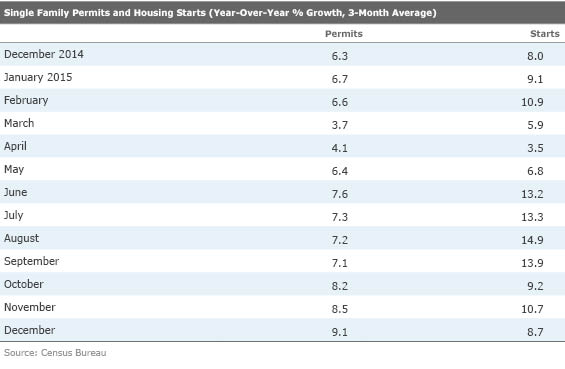
Overall, the Housing Market Looks Good if Not Quite Robust This week we received builder sentiment, housing starts, and permits as well as existing-home sales data. December is never a great month to assess the housing market because seasonal numbers are large compared with actual sales levels. That said, starts and permits were consistent with past months and suggest that single-family home construction annual growth rates of right around 9%. Growth has been running a little higher in multifamily with a lot of volatility, mainly because of some tax credit issues in New York City this summer.
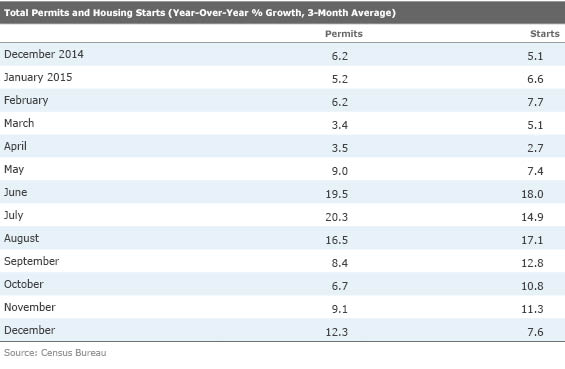
With permits running stronger than starts, the outlook for the months ahead is good. Total permits in December were running at a 1.232 million annualized rate, and starts were at a slower 1.149 million. The December permitting rate is relatively close to our 2016 forecast for starts of 1.210 million (about 9% compared with 11% growth in 2015 on a full-year basis that excludes seasonal adjustment factors that can confuse monthly data sets).
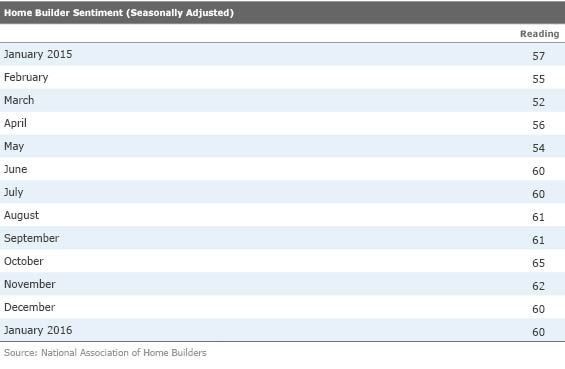
While it is starts and permits that we need to feed the housing pipeline, we were also pleased to see 981,000 homes under construction at the end of the year, a number that is way higher than the 828,000 units of a year ago. That is a backlog that will continue to support more workers and construction activity in the months ahead. We believe these are the highest levels of under-construction homes of the recovery. Builder sentiment remained exceptionally high, too, at 60, very near the recovery high of 65 (a bit of an outlier in October). The index has been at 60 or above since mid-year.
December Data Proves That Depressed November Existing-Home Sales Were Related to Paperwork Requirements We were a bit worried last month when existing-home sales made an unexpected dip. New paperwork requirements for lenders (not borrowers) were allegedly behind the slowdown. The pending home-sales report data (which showed little month-to-month change) supported that notion. Now December sales came bounding back to 5.46 million annualized units, after dipping to 4.76 million November, the worst level of the year. The December total was also above the simple average of monthly housing sales for all of 2015 (5.23 million units). Unfortunately, although the data is back on pace, the one-month snag remains in the quarterly data set, and that will depress brokerage commission in the fourth quarter--another black mark against the fourth-quarter GDP calculation just when we didn't need it. We also remain worried that inventories remain remarkably low, almost scary low if they are correct.
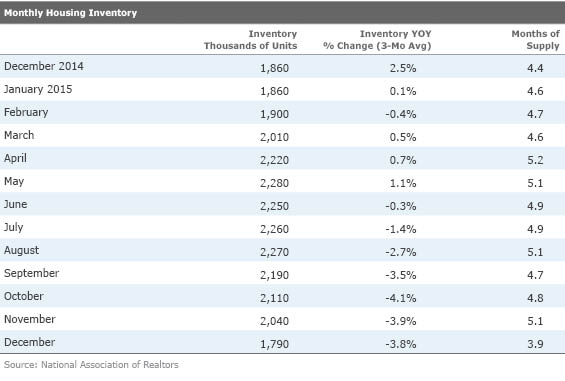
If there aren't homes in inventory for sale, it's hard for sales to go up. Although inventory is not seasonally adjusted, it still looks lower than other Decembers. It will also keep prices going higher, just what we don't need now. High prices, higher interest rates, and low inventories mean it will be very hard to grow existing-home sales at the 7% rate just reported for all of 2015, though 3%-5% growth is entirely possible, in our opinion. Just like in 2015, we expect housing starts growth to exceed (about 8%-10% in both years) existing-home sales growth. Clearly the supply of homes needs to grow, meaning that more building is necessary.
More Housing Data, a Likely Soft U.S. GDP Report, and Trade Data on Tap for Next Week The big news next week will be the much-dreaded first reading on the fourth-quarter GDP growth rate. The only good news about the report is that expectations are low, and the market has been pricing that in for most of the year. The consensus for the fourth quarter is now 0.7%, down from over 2% at the start of the quarter.
It is the quarter that could not catch a break, with a combination of bad weather (lower clothing sales and utility usage because of warm temperatures), unusual seasonal factors (auto sales and production figures are a train wreck because of the high day count to calculate December sales), and new form requirements in the housing industry that delayed sales (affecting broker commissions). Again, we are not terribly worried about the quarter because many of the special factors will begin reversing themselves in January. As bad as the single quarter may look, when you stack all four quarters of the year together, year-over-year growth should still be close to 2.4%, roughly the same as 2014 and most other years of the current recovery. Current employment data also seems to suggest that the economy is hardly slowing despite the sloppy GDP data.
The consensus now matches the Atlanta GDPNow forecast, which many readers have been pointing out to me, at 0.7%. My forecast had been 1.6%, which assumed a more modest inventory adjustment. Combined net exports and inventories are expected to take 1% off of the GDP growth rate. We generally don't pay too much attention to either of these, and neither should readers. Inventories have severe measure issues and are subject to several black-box adjustments that we can never seem to get right. The good news is that inventory adjustments in either direction bounce back in the following month.
The Atlanta Fed is suggesting that consumption, the key driver, will grow only 1.8%. Unless the utility hole is bigger than I suspect, I still believe consumption can grow 2% or maybe even a little more. I also believe that net exports will have no net effect on the GDP calculation. The statistic is net neutral after October and November, and I suspect soft retail sales may have greatly reduced the normal last-minute rush of imports in December. Warm weather may have limited energy-related imports from Canada, too. I am not so sure that we buy into nonresidential construction subtracting 0.2% from GDP, either. Those numbers look at least neutral to us based on a couple of construction reports. Realistically, the entire GDP number could be anywhere from 0.0% to 1.5%. Sorry for the big range, but it's the best we can do. And don't panic on the data announcement, either. It's fluky data and not a China contagion, as we are afraid many will assume.
Trade data next week is supposed to be little changed for goods, not inflation-adjusted at a deficit of $60 billion. Like the retail data, we really won't care until they inflation-adjust the data and include services in an early February report month. However, it may give us some clues if imports remained in their slump as we anticipate.
Since it is not a Fed meeting with new projections or a press conference, we doubt the Fed will take any actions at its meeting on Wednesday. We still anticipate that it will raise rates at least once in the first half of 2016.
On the real estate front, new-home sales, which give us insight on homes purchased but not started, are a great leading indicator of starts. We will also get a report on pending home sales that will be an early indicator of existing-home sales, and whether or not there is any possibility that the big December bounce, discussed above, is sustainable. We should also see some pricing data, which has been way too strong for our liking lately.
The manufacturing industry has stabilized recently as stronger domestically focused industries are starting to do better, offsetting some more export-related sectors. Excluding transportation, durable goods orders to be reported next week are expected to be unchanged, which seems reasonable, though recent purchasing manager data suggest orders might get to the black.

:quality(80)/cloudfront-us-east-1.images.arcpublishing.com/morningstar/PKH6NPHLCRBR5DT2RWCY2VOCEQ.png)