
The Whole Market for Free?
A race to lower expense ratios on broad-market ETFs, along with other factors, has pushed the estimated holding costs of many funds to nearly zero, writes Morningstar's Ben Johnson.
/s3.amazonaws.com/arc-authors/morningstar/a90ba90e-1da2-48a4-98bf-a476620dbff0.jpg)
A version of this article was published in the November 2015 issue of Morningstar ETFInvestor. Download a complimentary copy of ETFInvestor by visiting the website.
Thanks to the hypercompetitive nature of the free-market system, investors can now gain access to the market for free--almost. In November 2015,
As of Dec. 18, 2015, ITOT switched to a broader benchmark. It had been tied to the S&P Composite 1500 Index. Now, the S&P Total Market Index, or TMI, is its bogy. According to the S&P, the TMI had 3,947 constituents with an average market capitalization of $5.95 billion as of Dec. 31. The S&P Composite 1500 Index had 1,505 constituents with an average market cap of $13.94 billion as of year-end. Clearly, ITOT’s new benchmark is much broader than its predecessor, to the tune of 2,000- plus small- and micro-cap stocks. Unsurprisingly, the new benchmark is very similar to that tracked by ITOT’s chief ETF competitor,
While at face value the fund’s new benchmark might appear different, the changes are unlikely to move the needle much, and investors should expect much of the same from ITOT with regards to its performance profile. The S&P Composite 1500 Index captured 89.2% of the total market capitalization of the TMI as of the end of December. So while the number of individual stocks in the fund’s reference index will go up more than twofold, the total market capitalization of the new benchmark is only 12% greater. Furthermore, the two indexes have been perfectly correlated over the 10-year period ended Dec. 31, 2015. Over that same span, their performance has also been near-identical from both a return and a risk perspective. The S&P Composite 1500 Index generated 7.41% annualized returns over the 10-year stretch with an annualized standard deviation of monthly returns of 15.30%. Meanwhile, the TMI produced annualized returns of 7.35% with an annualized standard deviation of monthly returns of 15.59% over that same period.
ITOT is also getting cheaper. Thanks to a permanent reduction to its management fee, the fund’s expense ratio will be reduced to 0.03% from 0.07%. This gives ITOT a one-half share of the title of “World’s Cheapest ETF” (as measured by its expense ratio), putting it in a tie with
It’s important to remember that fees are just one piece of the total cost of ETF ownership. These costs can be cleaved into holding costs and trading costs. Fees are typically the largest and are certainly the most predictable component of the all-in cost of holding an ETF. Assuming otherwise perfect tracking, ETFs and index funds should produce performance that lags their benchmark index by an amount equal to the fees they take. But perfect tracking is a tall order--particularly in cases where benchmarks are very broad and their constituents are highly illiquid (think emerging-markets stocks, high-yield bonds, and so on). The portfolio management techniques employed by ETFs’ and index funds’ managers can help the funds hew more closely to their benchmarks or stray further from them than the drag created by fees alone. Also, fund sponsors can claw back ground with revenues generated from securities lending--by loaning securities in the portfolio to short-sellers, among others, in exchange for a fee.
We capture the net effect of fees and these portfolio management techniques with a proprietary metric we call “Estimated Holding Cost.” Estimated Holding Cost measures the realized performance of an ETF manager relative to the benchmark index after all expenses, both disclosed and undisclosed. Many of you might recognize this data point as it appears under the “Total Cost & Risk” section of the data featured in the “Performance” tab for individual ETFs on Morningstar.com. This calculation measures predictable returns of the portfolio’s net asset value relative to the underlying index, isolating the information in past performance data predictive of how a fund will perform against its index in the future. As I mentioned before, the largest component is likely to be the fund’s expense ratio. Like an expense ratio, the estimated holding cost is expected to be a positive number that represents the extent to which a fund has underperformed its benchmark. A smaller, or even negative, estimated holding cost shows that a manager is doing a better job finding the lowest-cost ways to replicate the benchmark index.
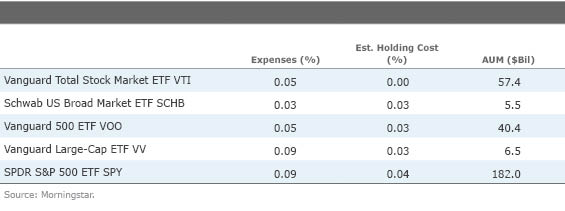
The accompanying table features the five ETFs with the lowest estimated holding costs within the U.S. large-blend Morningstar Category. In all but one case, these funds’ estimated holding costs are less than or equal to their expense ratios. This indicates that most of these funds have tracked their benchmarks extraordinarily well on a net-of-fees basis. In fact, four of them have tracked so well that they’ve managed to overcome a portion of the drag on their performance created by their fees. In the case of VTI, the fund has tracked so well (note the estimated holding cost of 0.0) that it is, for all intents and purposes, “free.”
Disclosure: Morningstar, Inc.'s Investment Management division licenses indexes to financial institutions as the tracking indexes for investable products, such as exchange-traded funds, sponsored by the financial institution. The license fee for such use is paid by the sponsoring financial institution based mainly on the total assets of the investable product. Please click here for a list of investable products that track or have tracked a Morningstar index. Neither Morningstar, Inc. nor its investment management division markets, sells, or makes any representations regarding the advisability of investing in any investable product that tracks a Morningstar index.
/cloudfront-us-east-1.images.arcpublishing.com/morningstar/24UPFK5OBNANLM2B55TIWIK2S4.png)
/cloudfront-us-east-1.images.arcpublishing.com/morningstar/T2LGZCEHBZBJJPPKHO7Y4EEKSM.png)
/d10o6nnig0wrdw.cloudfront.net/04-18-2024/t_34ccafe52c7c46979f1073e515ef92d4_name_file_960x540_1600_v4_.jpg)
:quality(80)/s3.amazonaws.com/arc-authors/morningstar/a90ba90e-1da2-48a4-98bf-a476620dbff0.jpg)