
Growth Fears Grip the Market
Weak U.S. headline economic data helped fuel the sell-off this week, but don't be tricked by short-term anomalies.

It's getting difficult to find new ways to say that market action was pervasively dismal. Equities around the world did poorly again this week, with most markets registering a 2%-4% decline. As usual, emerging markets did the worst, and the United States did the best. Commodities resumed their normal spot as the worst performer, as oil continues to slump. Most of the action in recent weeks appears to be related to slower worldwide growth, a fact supported by falling commodity prices and falling government bond rates. The U.S. 10-year Treasury bond yield fell from 2.23% to 2.13%.
However, this week it was the U.S. economy that drove growth concerns. Both industrial production and retail sales disappointed and showed outright declines. Those, along with some inventory data, sent economists back to the drawing board with new expectations of 0%-1% fourth-quarter GDP growth, compared with prior estimates of 1%-2%. If correct, that would move the full-year GDP growth forecast down to 2.4% from 2.5%, hardly something to get to upset about. A lot of the fourth-quarter reductions are related to volatile inventory data, near record low December utility usage, a renewed slump in the oil sector, and poor sales of anything related to cold weather and snow. With the possible exception of the oil sector, this is normal run-of-the-mill volatility that is likely to reverse itself, perhaps as soon as the first quarter. However, with weak headline data apparently spreading to the U.S. and last week’s China-related issues, investors are taking no chances and selling now, not wanting to lose all of their recovery gains.
U.S. economic news started the week on a high note with both the jobs opening report and the small-business sentiment report continuing to confirm last week's broad outline of a healthy job market. We do caution that courier jobs and weather-related construction gains are not likely to be sustained. However, the Challenger Gray layoff report, the JOLT report, and the small-business report all confirm a strong but not quite spectacular job market. Budget deficit data, announced midweek, was relatively neutral with little change in deficit levels in the first quarter compared with a year ago.
Then the bottom fell out on Friday with allegedly disappointing retail sales and industrial production numbers. With the consumer driving most GDP growth recently, the retail sales report disappointment scared a lot of economists. We aren't among them. When properly adjusted for deflation, we suspect that retail sales might have been up instead of the officially reported decline of 0.2%. Yet, everyone needs to see next week's Consumer Price Index to draw any firm conclusions.
Some of the more discretionary retail sector data showed surprising strength, including another whopping 0.8% growth in restaurant meals even in the face of
Retail Sales: Wait for Next Week Before Jumping to Rash Conclusions Markets didn't like this week's retail sales report at all, as headline sales fell 0.2% versus expectations of a 0.1% drop and well below the 0.4% growth rate in November. This fit with the broad consensus that holiday sales weren't great and the consumer continues to hunker down.
We believe this analysis and conclusion is both simplistic and potentially wrong. Shifting prices are making it impossible to interpret the data without a Consumer Price Index in the other hand. The problem with the retail sales report is that it isn't adjusted for inflation. That's fine when inflation is relatively constant and all categories are more or less in the same general direction. The necessary inflation data to make reasonable adjustments won't be available until the CPI data is released next week. And as we discuss later, the worst-looking categories were often the ones with the biggest potential price declines (apparel, gasoline, groceries, and electronics). Of course, it is a little less clear if those prices are lower because retailers slashed them to move inventories or because input prices of foreign goods fell because of falling prices.
Our year-over-year averaged data, excluding autos and gasoline and adjusted for the full CPI, is looking good relative to the rest of the recovery. However, it's not quite as good as when year-over-year oil deflation was much higher. Between 2010 and mid-2014, retail sales growth, excluding inflation, was very steady at 2%. A combination of lower energy prices in the inflation calculation and a burst of hiring in late 2014 and very early 2015 artificially inflated incomes. There is some chance that inflation-adjusted retail sales growth could still drop a little more in the months ahead. We are just a little worried that adjusting for general inflation and not category-specific patterns may also be affecting our carefully constructed data set.
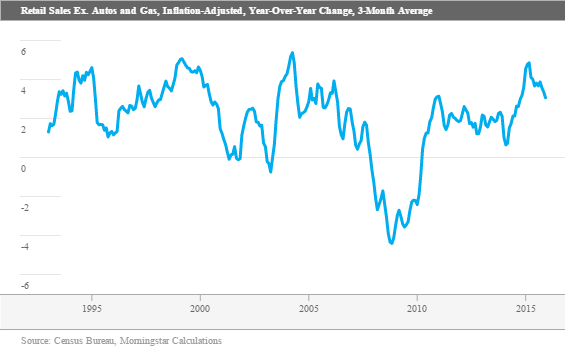
Inflation data next week will help us to interpret the data, but until we see the consumption report in early February, we won't have a more definitive view of consumer behavior.
Besides inflation, weather certainly played a role in the disappointing sales numbers. Warm weather is killing cold-weather gear.
That said, the retail sector data provided some tell-tale signs that the consumer is feeling just fine, thank you. The winners and losers data show some very impressive gainers.
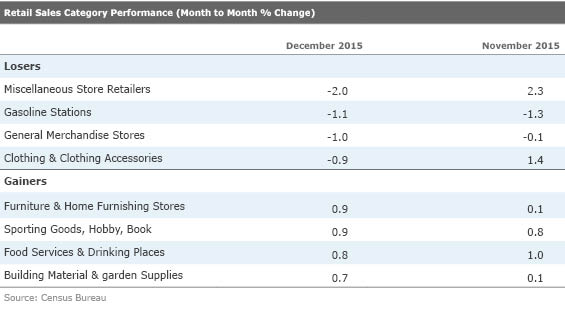
As regular readers already know, restaurant sales are a key indicator of short-term consumer sentiment. And despite the train wreck at Chipotle, restaurant sales continued to surge, as they have in almost every month of the year. This is the most discretionary, easiest-to-switch-off-spending category around. Month-to-month sales were up 0.8%, which annualizes to almost 10%. Even December-to-December sales were up 6.7%, which strips out any goofy seasonal factors and weather (both years were warm, with only slightly better conditions in 2015).
Increased spending on sporting goods and hobbies, even in the face of issues with cold-weather sports, also suggests that consumers have money to spend. Strength in furniture and building materials may be related to a delayed reaction to a strong housing market (both new and existing) earlier this year. The performance for the month and quarter in building materials comes even in the face of headwinds from slower snowblower, shovel, and salt sales, related to the warm weather this winter.
Meanwhile, the losers all had plausible, noneconomic-related issues. Clothing has been hit hard by warm weather that is depressing both unit volumes and price. And the high clothing growth number for a month earlier, November, seems a little puzzling. Year-over-year clothing sales are up 0.6% but look a little better if one adds back a minimum of 1.5% for price deflation (bringing the growth to a slow but not disastrous 2.1%). Also, the 1.1% monthly decrease in gasoline sales are potentially offset by a 5%-6% price decrease, meaning unit volumes (what GDP measures) were up in the neighborhood of 4% as consumers drive more. We are still seeking more information from the U.S. Census Bureau on the declining general merchandise issues. It's odd that department stores that are more dependent on clothing sales did better than the broader general merchandise category. Ongoing issues at
Auto sales, at 0.1% growth, were another detrimental factor in the December report. Again, sequential seasonal factors and working day factors in the calculation are a disaster for both the retail sales and industrial production reports. Violent upward swings in SUV, crossovers, vans, and pickup trucks, with their massive seasonal adjustment factors compared with conventional autos, make thoughtful monthly analysis of sales data close to worthless. (Production figures are messed up because of ever-changing summer shutdown schedules.) We always analyze the auto data at the beginning of the month and exclude the auto data from our analysis of retail sales (BEA doesn't use any part of the retail sales report to calculate GDP; it uses Ward's and manufacturer data instead.)
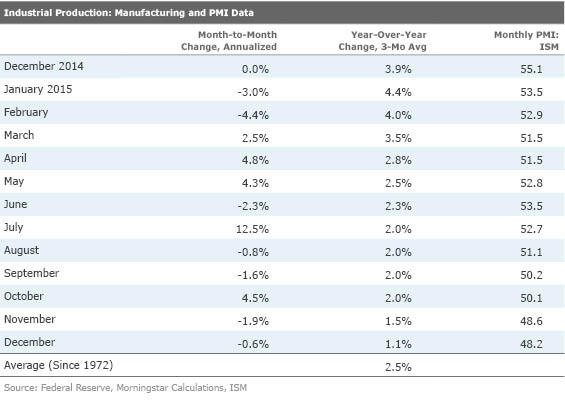
Manufacturing Data Remains Inconclusive The manufacturing industrial production report showed a decline of 0.1% for December after popping 0.4% in October then declining 0.2% in November. So manufacturing changed little when viewed over a full quarter, getting no worse and no better, hardly the strong-dollar-driven Armageddon the media is suggesting.
The Manufacturing Industrial Production Index has been stuck between 106.7 and 106.9 for a surprising six months dating back to July. In fact, the index averaged 105.7 in the first half, also in a very tight range, suggesting that manufacturing overall is stable if not modestly growing. That means the year-over-year data should start improving shortly as we lap some of the declines at the end of 2014 and the first few months of 2015.
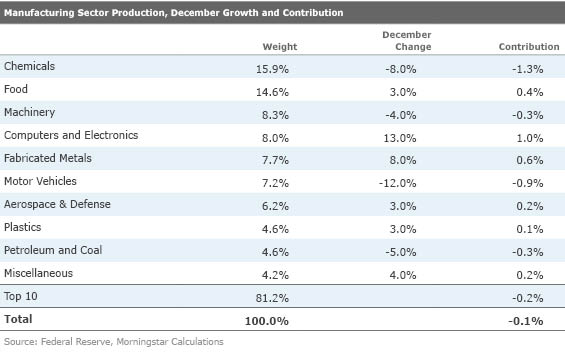
Manufacturing Sector Data Show That Not all Sectors Are Hurting Despite the lack of overall growth, some sectors are doing poorly and others are doing pretty well. Below is the latest version of the top 10 sectors, which account for about 80% of total production. Six of the top 10 showed improvement, and four showed declines. Chemicals, the largest sector, had a bad month following three very good months. No need for panic.
Autos also did poorly, but that is really all about faulty seasonal adjustment factors and not faltering demand or slowing production schedules. However, we admit to failing to notice that motor vehicle production allegedly grew by 20% in the third quarter. We assure you that reported growth rates of 20% in the third quarter are pure science fiction. The industrial base couldn't handle a production growth rate that high. Conversely, the auto industry didn't fall almost 8% in the fourth quarter, either.
Computers and electronics was one of the standouts on the growth side, and the surprisingly large food sector also did quite well, perhaps benefiting from lower input prices. These sectors are often ignored by commenters who believe manufacturing is on a one-way street to disaster.
Job Openings Report Confirms a Stronger Labor Market Although a combination of courier hires (related to online shopping) and construction workers (boosted by warm weather) provided a hefty tailwind to last Friday's job report, we continue to believe the labor market remains healthy. This week's continued low reading on initial unemployment claims and now the Job Openings and Labor Turnover report, last week's Challenger Gray layoffs report, and the ADP version of the labor report all support our conclusion that the labor market remains relatively healthy. The JOLT report showed a modest monthly increase in job openings (from 5.3 million positions to 5.4 million, which are very near their all-time high of 5.6 million established last July). Openings are an important precursor to the jobs report as an opening generally needs to be posted before a job can be filled. The number of openings continues to exceed hires (5.4 million versus 5.2 million) as they have for the past 10 months.
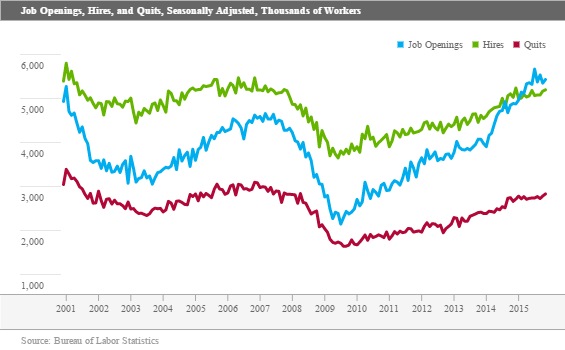
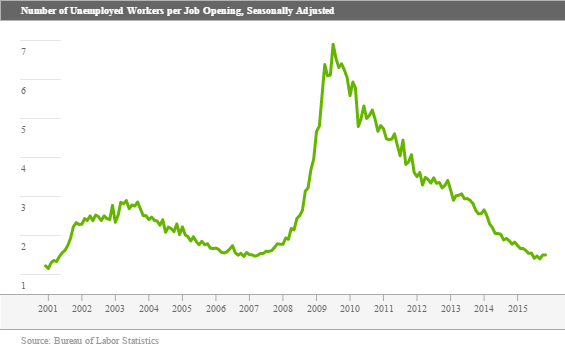
Prior to those 10 months, hires had always exceeded openings in the 15 years that the government had been tracking this metric. That trend is why we characterize the current labor market as tight. Our bold opinion is that it is a lack of qualified labor in the right locations and not a lack of jobs that is holding back the labor market and the economy from higher growth. Further supporting that conclusion, the pool of unemployed workers continues to diminish. The number of unemployed workers per open position is nearing the record lows near the turn of the century.
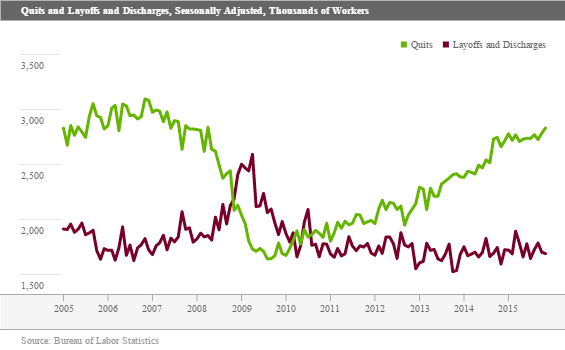
One combination of charts that the Labor Department provided shows that workers are increasingly feeling their growing power. The table below shows employers clinging desperately to new employees as the raw number of layoffs each month remains at very close to recovery lows and has even trended down in 2015.
Meanwhile, slowly and a bit erratically, voluntary quits have ground ever higher. Quits are a proxy for worker confidence in the labor market and the economy in general. The level of quits is now back to where it was at the start of the recession. If you look carefully, though, quits didn't move a lot higher in 2015 until there was a nice bounce at the end of the year. November quits moved from 2.78 million in October to 2.83 million in November after also moving higher by a similar amount in October. We caution that two months do not make a trend and the data is subject to revision. More interesting is the widening gap between layoffs and quits.
NFIB Report Confirms Growing Labor Market Issues We also enjoy looking at the National Federation of Independent Businesses report on labor conditions, found in its monthly survey of small businesses. The report showed stronger hiring intentions in small businesses. Right now, 15% of small-business owners plan to hire more employees in the next three months than those planning to reduce the labor force. That is up 4 percentage points between November and December and is now at its highest level of the recovery.
However, looking backward, hiring growth has remained nil. Every month employers say they are going to hire more workers, then we find out months later that they didn't actually get around to the hiring. It is increasingly difficult to fill positions, explaining at least some of the wide gap between intentions and reported hiring. A recovery-high 48% of those firms with an opening are finding few if any qualified applicants. However, we note that this reading has been in the mid-40s for most of the year. Intentions to raise wages are also continuing to increase and are now at a recovery high of 20%. Unlike some of the other survey items, wage intentions have improved, both on a year-over-year basis and throughout the months of the year.
Furthermore, labor/quality issues are now front-and-center for small-business owners. Each survey asks respondents to name their biggest business concerns from a list of 10 items. Since the recession, taxes and regulation have been the biggest areas of concern, each garnering well over 20% of survey results. Regulation, often land use or paid time issues, have continued to grow as a concern; taxes, perhaps because of recently enacted legislation, have diminished in importance. However, labor quality issues have now moved into the number-three position at 15%, exceeding sales growth for the first time during this recovery. Interestingly, the 15% labor quality concern is way above well reported concerns about insurance (9%). Also interesting is the fact that cost of labor is a relatively minor concern at 5%.
We have often cited the labor portion of the NFIB, but have sometimes shied away from using the composite reading. The headline numbers are bumpy, seem to be influenced by headlines (such as the consumer sentiment surveys we so detest), and have been very dour (though generally improving from recovery lows) for most of this recovery. The average headline reading is 98 over the past several decades, and right now it is at 96.2. Still, the recent reading isn't much different from most of the rest of the year (96). To us, the lower than average number in this recovery represents a lot of ongoing secular pressures on small business (taxes, regulation, labor availability).
It also seems to be that expectations have been for higher growth and better conditions that were not justified by results in the recent past. Just like the Federal Reserve, there was a lot of hope that somehow the economy would reach some kind of escape velocity and return to the good old days of more rapid growth. Some of the expectation data, both good and bad, now seems more realistic, and the gap between expectations and past reality seems to be narrowing in some but not all categories. This new realism may be responsible for the overall dour mood.
Short run, we are encouraged that the small-business index has held up despite a terrible stock market, terrorism headlines, and some weaker headline economic data. December actually was better than November. That usually doesn't happen. I suppose less dependence on foreign markets may explain why small businesses aren't panicking, as we might normally expect.
Housing and Inflation Will Dominate Economic News Next Week (by Roland Czerniawski) Real-estate-related news will dominate next week's holiday-shortened trading week. We will receive December's reading on builder sentiment, housing starts and permits, and existing-home sales. However, weather and large seasonal adjustment factors (because of generally low sales over the holidays) make this a bad time of year to evaluate the health of the housing industry.
The consensus for starts calls for around 1.2 million units, annualized. We think this estimate seems reasonable, but there is a possibility of an upside surprise. The 1.2 million starts figure implies a modest 2.3% monthly increase. The reason the number might surprise on the upside is the fact that last month was one of the warmest Decembers on record. At the same time, seasonal factors for December are some of the strongest for the entire year. This could elevate the starts data meaningfully.
Existing-home sales should show signs of life as the November data plummeted because of a new law that potentially slightly delayed sale closings by requiring additional paperwork. As a result, November sales collapsed 11% to 4.76 million units annualized, making a meaningful rebound in December very likely given healthy pending home sales data. The consensus calls for 5.2 million units, and we think that the number could even come in as high as 5.3 million or 5.4 million units, reverting to its trend. Such results would provide some cushion against already low fourth-quarter brokers' commissions, which are an important part of the residential investment GDP calculation.
Finally, the Consumer Price Index is due on Wednesday, and we expect a 0.1% monthly decline, which would bring the year-over-year inflation rate to around 0.7%. The main concern is overall prices moving down more than expected on the goods side of the equation, as holiday discounts at the mall seemed bigger than usual. Those mall-based price declines may be behind that weak retail sales report discussed above. Gasoline prices were down in December yet again, this time by about 4%. Low energy prices have kept the inflation rate at bay in 2015. With that being said, core CPI, which excludes the volatile energy and food categories, is expected to advance 0.1% in December, bringing the core inflation rate to a 44-month high at 2.3%. We will be closely watching healthcare prices too, as they have showed some renewed growth recently.
/d10o6nnig0wrdw.cloudfront.net/04-22-2024/t_ffc6e675543a4913a5312be02f5c571a_name_file_960x540_1600_v4_.jpg)
/cloudfront-us-east-1.images.arcpublishing.com/morningstar/PKH6NPHLCRBR5DT2RWCY2VOCEQ.png)
/cloudfront-us-east-1.images.arcpublishing.com/morningstar/54RIEB5NTVG73FNGCTH6TGQMWU.png)