
Defensive Exposure to Small-Cap Stocks
This ETF should give small-cap investors a smoother ride, though it has some distinct risks.
/s3.amazonaws.com/arc-authors/morningstar/56fe790f-bc99-4dfe-ac84-e187d7f817af.jpg)
Small-cap stocks are generally more volatile than their larger counterparts, but they should still have a place in a well-diversified portfolio. More risk-averse investors looking for exposure to these stocks might consider
Each quarter, this fund targets the least-volatile 120 stocks in the S&P SmallCap 600 Index over the past 12 months and weights its holdings by the inverse of their volatilities, so that the least-volatile stocks receive the largest weightings in the portfolio. However, it does not take into account the correlations between these holdings. The implicit assumption behind this strategy is that relative volatility should persist: Yesterday’s low-risk names will continue to exhibit low volatility in the short term. While this isn’t always the case, index data from S&P and academic studies suggest that this relationship has generally held in the past. This isn’t surprising because low-volatility stocks’ cash flows tend to be less sensitive to the business cycle than most.
Relatively stable cash flows can also make these stocks more sensitive to changes in interest rates. Interest rates generally rise during periods of economic strength. However, low-volatility stocks may have less growth than the broad market to offset the negative impact of higher rates. The fund’s large real estate stake (25% of the portfolio) contributes to its interest-rate risk, as higher interest rates can reduce property values and increase real estate investment trusts’ financing cost. This risk is somewhat mitigated by the fund’s considerable exposure to banks, which could benefit from widening net interest margins resulting from higher interest rates. But overall, the fund will likely expose investors to greater interest-rate risk than broader market-cap-weighted alternatives.
Sector tilts can also increase risk, as this fund does not constrain its sector weightings. The fund has significantly greater exposure to the financial services (this sector represents 29% of the portfolio) and real estate sectors than the S&P SmallCap 600 Index. Not surprisingly, it has much less exposure to the technology, consumer cyclical, and healthcare sectors than this benchmark. While large-cap healthcare stocks tend to be fairly defensive, riskier biotech names represent a bigger part of the sector in the small-cap market. However, the composition of the portfolio can change considerably over time. In two of the past three years, its turnover exceeded 50%.
Low-Volatility Investing Theory Clearly, low-volatility investing carries some distinct risks, but this strategy should offer a lower risk profile than traditional market-cap-weighted alternatives. Investors can also reduce risk by holding more cash. In order for low-volatility investing to make sense, it would need to offer a more favorable risk/reward trade-off (even if it offers lower absolute returns) than the broader market. Low-volatility stocks have historically accomplished this feat, and there is reason to believe they will continue to do so over a full market cycle.
Institutional frictions might cause low-volatility stocks to become undervalued relative to their risk. Most mutual fund managers are evaluated on their performance relative to a benchmark, but many are unable or unwilling to borrow to boost returns. Low-volatility stocks may be unattractive to them because they likely offer lower expected returns than the market (particularly during bull markets). This can depress their prices relative to their risk and set up strong risk-adjusted returns over the long term. In the absence of leverage constraints, investors could borrow to parlay low-volatility stocks’ attractive risk/reward profile into market-beating returns. Demand for these stocks would likely increase and the effect would probably be much smaller. (For further reading on the link between leverage constraints and risk-adjusted returns, see “Betting Against Beta.”)
This explanation suggests that while low-volatility stocks may offer better risk-adjusted returns than the market, it is not reasonable to expect them to offer higher absolute returns over the long term. To the extent that there is a return benefit, it should come during market downturns. However, these stocks can lag considerably in stronger market environments.
In the small-cap market, there actually might be a small return benefit from avoiding the most-volatile stocks, many of which carry high valuations and invest a lot despite poor profitability. Historically, these stocks have offered terrible returns. A possible explanation is that investors might overpay for highly volatile stocks, which offer a small chance of a large payout, similar to a lottery ticket. Early-stage small-cap biotech stocks might fit this mold. They can offer spectacular returns if the FDA approves one of their products, but otherwise languish. Investors could become overly optimistic about these firms’ prospects and overpay for them. But because lotterylike stocks represent a small part of the market, avoiding them probably won’t have a very big impact on performance.
The committee that maintains the S&P SmallCap 600 Index (the selection universe for XSLV) tries to keep lotterylike stocks out of the index when it selects new constituents. Qualifying stocks must have positive earnings over the previous four quarters, and the committee may consider other measures of financial viability. This gives the fund a good starting point on which to build.
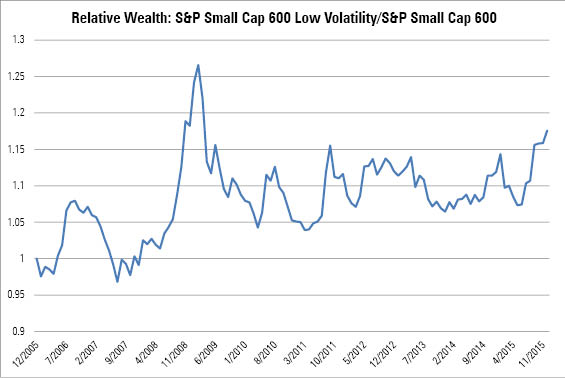
Performance The fund was launched in February 2013, so it does not yet have a significant live record. Over the past 10 years, its benchmark exhibited about 77% of the volatility of the S&P SmallCap 600 Index (based on back-tested data). This volatility reduction is similar to the corresponding figure for the S&P 500 Low Volatility Index relative to the S&P 500. During that time, the S&P SmallCap 600 Low Volatility Index outpaced its parent index by 1.85 percentage points, though it may not be reasonable to expect this strategy to continue to offer higher returns over the long term. Not surprisingly, the strategy outperformed during the bear market from October 2007 through March 2009, lagged in the early part of the recovery, and outperformed in the second half of 2015.
The relative wealth chart below illustrates the S&P SmallCap 600 Low Volatility Index’s performance relative to the S&P SmallCap 600 Index over the past decade. When the line slopes up, the low-volatility index is outperforming, while the opposite is true when it is sloping down.
- Source: Morningstar Analysts
Alternatives SPDR Russell 2000 Low Volatility ETF SMLV is the closest alternative. It follows a similar approach, targeting the least-volatile 400 stocks from the Russell 2000 Index over the previous 12 months and weighting its holdings by the inverse of their volatility. However, it rebalances the portfolio each month and makes some adjustments to limit turnover and unintended style tilts. SMLV's 0.12% expense ratio is a fraction of XSLV's, but it is more thinly traded, which can increase transaction costs.
Actively managed
References
1) Novy-Marx, R. 2014. "Understanding Defensive Equity." NBER Working Paper No. 20591. http://www.nber.org/papers/w20591
2) Frazzini, A., & Pedersen, L.H. 2014. "Betting Against Beta." Swiss Finance Institute Research Paper No. 12–17. http://papers.ssrn.com/sol3/papers.cfm?abstract_id=2049939
Disclosure
Morningstar, Inc.'s Investment Management division licenses indexes to financial institutions as the tracking indexes for investable products, such as exchange-traded funds, sponsored by the financial institution. The license fee for such use is paid by the sponsoring financial institution based mainly on the total assets of the investable product. Please click here for a list of investable products that track or have tracked a Morningstar index. Neither Morningstar, Inc. nor its investment management division markets, sells, or makes any representations regarding the advisability of investing in any investable product that tracks a Morningstar index.
/cloudfront-us-east-1.images.arcpublishing.com/morningstar/24UPFK5OBNANLM2B55TIWIK2S4.png)
/cloudfront-us-east-1.images.arcpublishing.com/morningstar/T2LGZCEHBZBJJPPKHO7Y4EEKSM.png)
/d10o6nnig0wrdw.cloudfront.net/04-18-2024/t_34ccafe52c7c46979f1073e515ef92d4_name_file_960x540_1600_v4_.jpg)
:quality(80)/s3.amazonaws.com/arc-authors/morningstar/56fe790f-bc99-4dfe-ac84-e187d7f817af.jpg)