
Rolling Down the Yield Curve With Defined-Maturity Bond ETFs
A fixed-income strategy for squeezing the most yield out of your bond portfolio.

A version of this article was published in the November 2015 issue of Morningstar ETFInvestor. Download a complimentary copy of ETFInvestor here.
Flaw of Averages Duration, by itself, is a crude measure of interest-rate sensitivity. It assumes a linear and instantaneous shift in interest rates across the entire yield curve. A more accurate assessment can be made when convexity is considered alongside duration, but that is outside the scope of this article. It is worth noting, however, that duration calculations are even cruder when it comes to a portfolio of bonds.
As an example, consider two portfolios: The first uses a barbell approach with 50% of assets in one-year bonds and 50% in 10-year bonds, while the second portfolio allocates all of its assets to five-year bonds. The aggregate duration calculation for these two portfolios may appear equal, but the portfolios will behave differently because of their distinct positioning across the yield curve.
Though oversimplified, this example helps illustrate why bond investors should be mindful of the shape of the yield curve and where a bond (or portfolio of bonds) is positioned along that curve. Remember, a yield curve that shifts uniformly across all maturities exists only in theory. The reality is that short- and long-term interest rates react much differently to an uptick in the federal-funds rate.
Given that the federal-funds rate is a measure of the overnight lending rate between deposit banks, it follows that the short end of the curve is most sensitive to changes in the benchmark rate. In practice, we could very well see short-term rates rise more than long-term rates--a scenario often referred to as a "bear flattener."
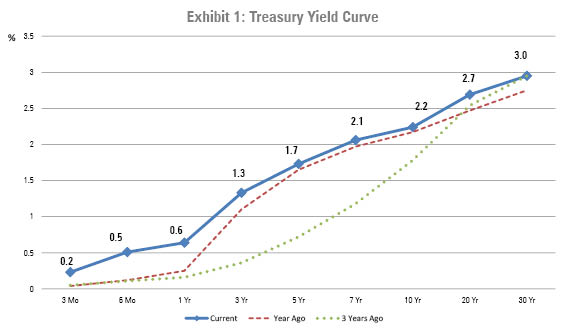
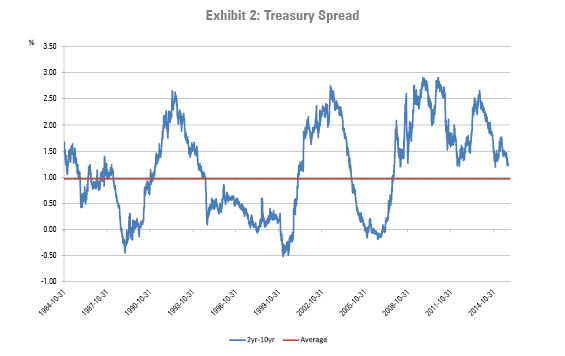
Current Yield Environment An upward-sloping yield curve, like the current one (see Exhibit 1), is considered normal. The shape and steepness of the curve will, of course, fluctuate with market conditions. As shown, the yield curve has flattened a bit relative to where it was three years ago. Investors can gauge the steepness of the curve by measuring the spread between 10-year and two-year Treasury yields.
To help provide some context, Exhibit 2 shows the historical spread going back more than three decades. At the beginning of November, the spread clocked in at 144 basis points, or 47 basis points above its long-term historical average (since 1976), which is represented by the flat line on the chart.
Rolling Down the Yield Curve The strategy of "rolling down the yield curve" targets investing in bonds at the steepest part of the curve. After a year or two, the bond is sold and the proceeds are reinvested back up the curve into higher-yielding, longer-maturity bonds. By selling the position well ahead of the actual maturity date, the strategy aims to capture the price increase that results when a bond's yield drops as it "rolls down" the curve (that is, it moves closer to maturity). From there, the process repeats.
To illustrate, we can look at an example based on the yield curve in Exhibit 1. Consider an investor who buys a five-year Treasury paying a 1.5% coupon rate at par value. Fast forward two years, and that original five-year Treasury still yields 1.5%, but at that point it would have three years left to maturity. As can be seen in the yield-curve chart, the Treasury yield at a three-year maturity is 1.05%. Therefore, the price of the originally purchased five-year Treasury (which now also has a maturity of three years) would increase in order to ensure that its yield to maturity aligns with the current yield curve. (Note that, for the sake of simplicity, this example assumes that the yield curve remains stable over the observation period.)
If the Treasury paid a 1.5% coupon at a face value of $100, then after two years the price would have actually risen to $101.35 so that its yield to maturity matches the prevailing market. Recall that the three-year Treasury has a coupon yield of 1.05%. The original five-year Treasury in this example maintains its annual coupon yield of 1.5%, but then faces annual price declines of about $0.45 over the remaining three years until it matures. The yield to maturity balances out to 1.05% after factoring in those future price declines, which of course is equivalent to the yield to maturity that an investor could earn at that time from buying a newly issued three-year Treasury at par.
A buy-and-hold investor who bought at $100 would collect 1.5% per year in coupon payments and receive $100 at maturity. That comes out to a total of $7.50 in interest payments. The "roll down" strategy described in our example, on the other hand, could generate $10.90 in total returns during the same period thanks to locking in price gains and reinvesting into higher-yielding bonds.
Implementation Thanks yet again to innovation in the realm of exchange-traded funds, the walls have come down and individual investors now have efficient access to tools that enable them to implement a strategy that only the big boys on the block could implement. Without the benefit of such scale and low relative trading costs, the cost hurdle was far too high for most individual investors and advisors trying to implement this strategy using individual bonds.
Then came along a new breed of fixed-income fund that combines the diversification and accessibility of an ETF with the precision of an individual bond. While an index, for example, typically maintains a fairly stable maturity range, these ETFs have specified maturity dates upon which cash is distributed back to investors. That means, just like an individual bond, the duration of these ETFs will steadily decrease as it approaches maturity.
Exhibit 3 contains a list of all the defined-maturity bond ETFs currently available.
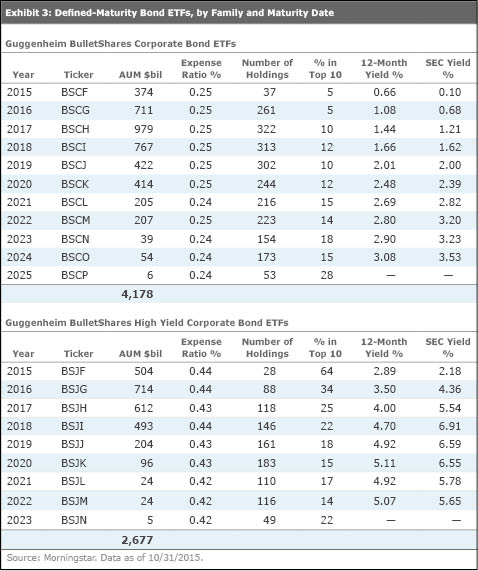
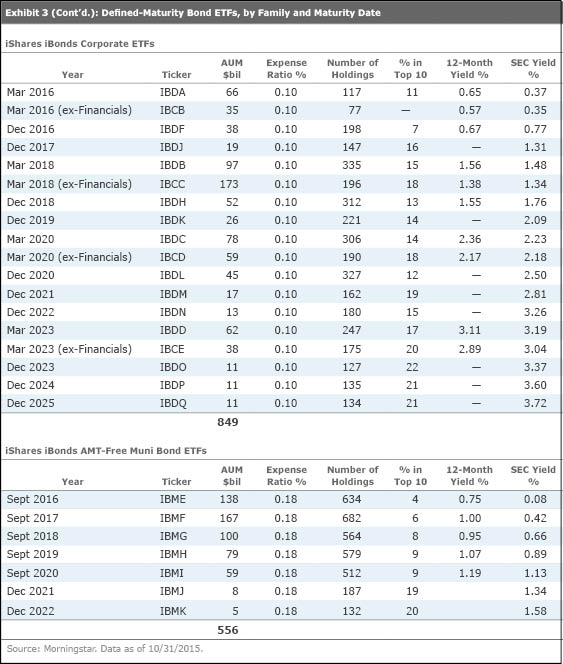
These ETFs are typically pitched as a way to build bond ladders in order to match cash flows with future liabilities. But thanks to their precise exposure and individual bondlike characteristics, defined-maturity ETFs--which are relatively cheap to trade--are also great tools for executing customized "roll down" strategies to enhance fixed-income total returns.
Even for relatively large investors, the wide bid-ask spreads and dealer mark-ups or commissions incurred when buying and selling individual bonds present a high hurdle. Moreover, the minimum investment that would be required could be another barrier to entry. Often, investors will be dealing in "odd lots," which typically trade at wider spreads, as they are considered less liquid.
One of the attractive traits of an individual bond is the visibility of its cash flows and knowing exactly how much principal is due to you at maturity. Contrast that against a bond index, which does not mature and will see slight variations in its cash flows as it rebalances or reconstitutes over time. In the case of an actively managed portfolio, the payout will fluctuate as the portfolio manager buys and sells bonds. While there are several ETFs that target a relatively narrow portion of the yield curve, they still lack the precision and flexibility of defined-maturity bond ETFs.
This is another example of ETFs democratizing the investment landscape. Armed with these innovative solutions, investors have yet another arrow in their quivers to manage their fixed-income allocation amid a low-interest-rate environment. Be sure to monitor the steepness of the yield curve when executing the strategy, and keep in mind that the "roll down" strategy will lose a lot of steam if the yield curve flattens more than expected. As great as it sounds on paper, this strategy is still not a free lunch. The buy-and-hold investor sees price volatility steadily decease as his bond nears maturity. However, the price volatility in the "roll down" strategy stays relatively high, given that it reinvests in longer maturities, which tend to experience larger price fluctuations. The premium earned via the strategy can be considered compensation for assuming slightly longer duration and higher levels of volatility.
Disclosure: Morningstar, Inc.'s Investment Management division licenses indexes to financial institutions as the tracking indexes for investable products, such as exchange-traded funds, sponsored by the financial institution. The license fee for such use is paid by the sponsoring financial institution based mainly on the total assets of the investable product. Please click here for a list of investable products that track or have tracked a Morningstar index. Neither Morningstar, Inc. nor its investment management division markets, sells, or makes any representations regarding the advisability of investing in any investable product that tracks a Morningstar index.
/cloudfront-us-east-1.images.arcpublishing.com/morningstar/T2LGZCEHBZBJJPPKHO7Y4EEKSM.png)
/d10o6nnig0wrdw.cloudfront.net/04-18-2024/t_34ccafe52c7c46979f1073e515ef92d4_name_file_960x540_1600_v4_.jpg)
/d10o6nnig0wrdw.cloudfront.net/04-09-2024/t_e87d9a06e6904d6f97765a0784117913_name_file_960x540_1600_v4_.jpg)