
Why Inflation May Overrun the Fed
Labor market tightening, housing shortages, and an eventual stabilization in commodity prices could move inflation sharply higher, upsetting the Fed's gradual strategy.

It was another one of those weeks with lots of daily changes but little net change by the end. Most developed world markets were little changed for the week, running up early in the week before the Federal Reserve's interest-rate hike, then spending the rest of it worrying about the longer-term path for interest rates along with oil and commodity prices, which still haven't managed to find a bottom. Commodity indexes were down almost 2% on the week.
Emerging markets, which were anticipating the worst from the Fed, managed a healthy 3.8% gain for the week. Better economic data in China may also have helped boost the emerging markets. For the week, the U.S. 10-year Treasury rate increased from 2.14% to 2.20, having already anticipated the Fed's 0.25% short-term rate increase.
While the Fed garnered almost all of the attention, the real news was on the economic front around the world. News out of China included better-than-expected retails sales, industrial production, and even home prices, suggesting that while China's economy is no longer bustling, it is not falling apart, either. Purchasing manager data for the European manufacturing sector also continued to improve, with notable gains in employment when combining manufacturing and service sector data. The improvement in Europe appears to be in the early stages of growth, with gains feeding on themselves in a virtuous cycle.
The U.S. economic data also looked better. Although headline industrial production was down, most of the decline was the result of warm weather and a decrease in natural gas and electricity usage. The manufacturing-only sector showed month-to-month improvement for the second month in a row. It is not really exports or the strong dollar that have limited growth recently, as the popular narrative would have you believe. Instead, a strong but slowing auto sector,
Current Consumer Price Index inflation was close to zero month to month for November, but year-over-year inflation rates have moved up from small declines early in the year to 0.5% growth in this week's report as the effects of lower gasoline prices begin to burn off. That number should be up over 1% in January and over 2% by June. Depending on commodity prices, inflation could range from 2% to 3% by next December. The short-term deflation for goods in November coupled with an already-impressive retail sales report will likely drive the goods portion of next week's all-important consumption report to a sharp 0.6% to 0.8% growth rate. Unfortunately, low utility usage because of warm weather may mask some but certainly not all of that improvement.
We viewed this week's Fed announcement of a quarter-point hike in the federal-funds rate as a nonevent and surmise that economic growth rates and rates of inflation will drive interest rates going forward, not the Fed. Though the Fed is just acting on short-term rates now, 10-year Treasury yields were already up from 1.75% in early 2015 to 2.25% currently. Those moves anticipated Fed actions, and the 10-year yield was actually lower after Wednesday's Fed announcement of a short-term rate rise. Supply and demand for money ultimately set interest rates, not the Federal Reserve. World history is littered with central banks that were under the illusion that they control rates.
One interesting note is that despite all the worries about inflation and the Fed's zero rate policy since 2008, rates since those policies were enacted have seen consumer prices increase at a compound annual growth rate of just 1.1% to 1.5%, depending on exactly which month one chooses as a starting point. In light of that low inflation rate, those low rates were not nearly as silly as many believed.
However, as we note in more detail below, headline inflation is set to accelerate shortly without much change in the underlying fact set, if gasoline prices just stabilize. Labor market tightening, housing shortages and eventually a stabilization in commodity prices could compound the already-known inflation factors (high services inflation and smaller gasoline price declines) and move inflation sharply higher, even by the end of 2016. That could quickly upset the Fed's gradual rate-increase strategy of moving rates from 0.4% now to 1.4%, 2.4%, and 3.3% for 2016, 2017, and 2018, respectively. Wall Street is even more asleep at the wheel believing rates will increase slower than that. My guess is that the Street is focusing on the slow rate increases now and is choosing to ignore the 3.3% forecast for 2018. While we economists are all brushing off this week's small increase and even a 1% increase by the end of 2016, a 3.3% rate sounds like a scary prospect to us.
Unfortunately, some of the unfavorable demographics that will cause labor shortage and price hikes may also limit economic growth. In other words, it seems that some of the seeds of stagflation could be brewing now. Even worse, Fed rate increases could simultaneously slow growth and raise inflation. Higher rates could slow homebuilding and raise home prices and rents, and limit corporate spending on labor-saving devices that could alleviate the coming labor shortages.
In the short run, economic growth should look better than many had anticipated, so don't necessarily panic. A rush to beat more rate hikes might actually help economic growth rates. And it may take a few more months for inflation to become truly visible. Because so many have cried wolf on inflation for so long, we may have to see one of those high inflation "prints" before anyone begins to worry. Hopefully we are wrong in seeing potential stagflation, but at least one needs to be thinking of what to do if rates move modestly higher and inflation becomes more visible. The good news is that slow growth demographics and tight fiscal policies make it highly unlikely that we will see anything resembling the inflationary spiral of the 1970s. Still, the potential to move from 0% to 3% inflation over a short period of time is not to be sneezed at.
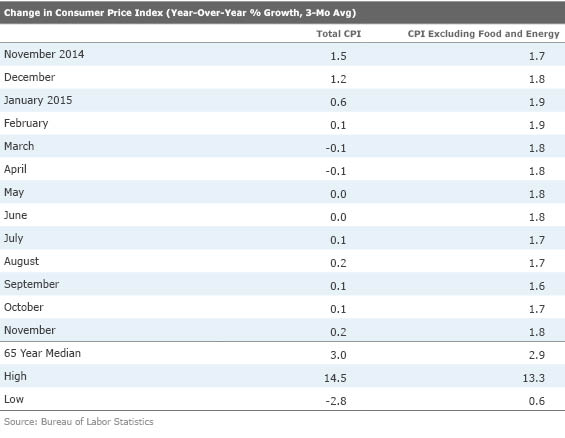
Can the Good CPI Data Last? The headline CPI data for November hit expectations on the head. Month to month, there was no headline inflation yet again, and core inflation remained at the 0.2% level of the last two months. These figures all matched expectations.
On a single-month, year-over-year basis, headline inflation was up 0.5%, the highest level since the effects of lower gasoline prices began to drop out of some of the data sets. Excluding food and energy, prices were up 2% year over year. As year-over-year gasoline prices decline at a much slower rate, headline inflation should approach the 2% core rate. In fact, single-month year-over-year inflation rates have moved from negative 0.2% in January up to 0.44% for November and likely will jump to over 0.7% in December, even if prices slump in December, as we expect. That rate could easily jump to 1.4% in January, on a year-over-year basis, again even if January prices remain unchanged. All of this suggests that deflation fears were a bit overblown and perhaps the Fed began raising rates just in the nick of time.
However, slumping gasoline prices and unusually low natural gas prices, due to warm weather, are likely to put off the final day of reckoning (that is, a 2% headline inflation rate that is a significant psychological hurdle). Earlier expectations were for inflation to hit 2% in January or February, but now that looks more likely to happen closer to the middle of the year. Lower food prices will also likely keep year-over-year food inflation under wraps early in 2016. Last year at this time, food inflation, which comprises 14% of the CPI, was up by more than 3%.
Our preferred averaged, year-over-year data is reacting a bit more slowly to the more rapidly rising single-month numbers we discuss above. However, those, too, will begin a somewhat slower ascent in 2016.
Services Inflation Still Worrisome The rise in inflation rates is inevitable given that goods prices can't keep going down forever and services prices are clearly on the rise. We have been warning of labor market tightness as well as a lack of new housing stock as reasons for services inflation to keep increasing, perhaps dramatically.
Services inflation is quite high at 2.9% year over year, up another 0.1% from the prior month. Energy, goods, and now food are currently masking this high and accelerating inflation rate in services. Though our forecast for fourth-quarter-to-fourth-quarter CPI is 2.0% to 2.5%, some type of supply shock, even a mild one, in the food or energy sector, could theoretically push headline inflation to 3% by the end of 2016.
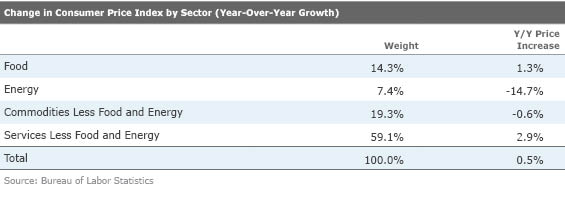
Furthermore, it won't be easy to bring down services inflation. More than a third of the overall CPI and half of the services less commodities subcomponent relates to rent or owners' equivalent rent. With slow growth in housing starts, tight rental markets, and increased household formation, it's hard to imagine that the rent and owners' equivalent rent inflation will slip below the current 3.2% year-over-year growth rate any time soon.
Paradoxically, higher interest rates that the Fed is envisioning could make the problem even worse, causing builders to scale back, reducing supply, and raising prices. Economists have consistently underestimated pressures on the housing industry. The miss in home price growth in 2015 was huge, with analysts estimating that prices would go up just over 3% or so in 2015. With 10 months of data, it looks like prices on a full-year averaged basis will come in well over a 5% rate. Those home-price increases are likely to translate into a higher rent component for the CPI in 2016. Much of that surprise increase in prices was that housing starts fell sharply below plan, too.
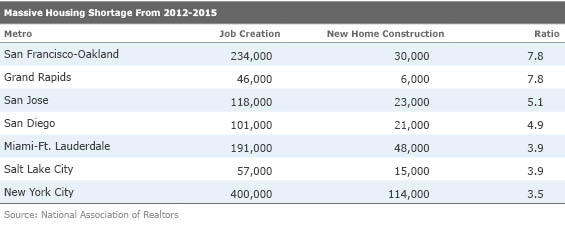
While the perception is that home-price increases might slow a little from 5%-6% in 2015 to 4%-5% in 2016, we sincerely doubt that they will. Even if they do, the supply and demand in some markets is profound. A slide used in a National Association of Realtors presentation was eye-opening. The mismatch between where jobs are being created and where new homes have been built recently is large, at least in a few markets, including some major ones. Those geographic mismatches are likely to drive up both home prices and rents, at least in those markets.
Goods Price Deflation Likely to Drive Up November Consumption Report Last week, I wrote that it was impossible to read much from the retail sales report without knowing this week's inflation report. Given a lot of positives for consumers, the November retail sales report was nothing to write home about, according to some pundits. However, we warned that variable inflation rates made the report look worse than it really was (in addition to some auto industry reporting issues). We guessed last week that an annual 4% decline in electronic-store sales would be more than wiped out by 7.5% price deflation, producing unit growth of a more appealing 3.5%. This turned out to be close to the mark. In the just-released November report, many other goods also decreased in price, even on a month-to-month basis, including apparel, groceries, appliances, and jewelry. A combination of accelerating growth in sales (less autos and gasoline) and deflation in November instead of inflation in October will produce a stunning consumption report, at least on the goods side of the house. Nominal retail sales improved from 0.2% growth in October to 0.5% (excluding autos and gasoline). In the meantime, inflation on this same broad category moved from zero to minus 0.2%. So on an inflation-adjusted basis, growth in goods could improve from 0.2% growth in October to 0.7% in November, an increase that is sure to get everyone's attention.
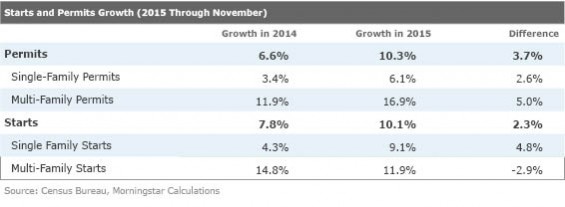
Strong Construction Data in November Not All Weather-Related by Roland Czerniawski The U.S. construction sector showed continued signs of improvement as both starts and permits advanced at a double-digit pace in November. Permits rose 11.0%, while starts increased 10.5% month to month. Year over year, the improvements were even more pronounced (19.5% and 16.5% permits and starts, respectively), since November last year was pretty average. On a three-month moving average basis, the data suggest growth stabilizing at around 10% for both permits and starts.
The builder sentiment, too, appears to be in line with a good starts and permits report, reinforcing relatively strong levels of confidence among homebuilders. While the sentiment value declined by a point from 62 in October to 61 in November, it still remains relatively high, showing that housing-construction conditions remain favorable.
Some pundits might attribute this strong November report to unusually warm weather in the Northeast and Midwest, where air temperatures and snow can severely affect the pace of growth in the construction industry. This does not appear to be the case. November's starts gains came almost exclusively from the South (the largest construction market) and West (the second largest). Starts in the South rose 21.3% in November (35.5% year over year), reiterating that the worries of a construction slowdown triggered by lower oil prices in Texas remain largely unfounded.
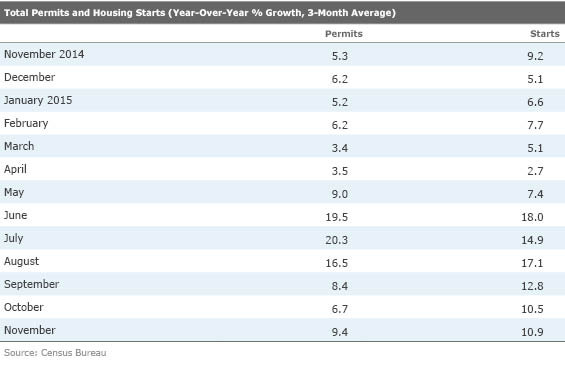
Overall, 2015 is on track for 10% growth for both starts and permits. While we still have one more month of data before the year is finished, it would take a large contraction in December to derail this growth into single-digit territory. While construction did not necessarily take off in 2015, it did accelerate significantly compared with 2014. While multifamily segments continue to grow at a double-digit pace, the single-family growth in both starts and permits roughly doubled in 2015 after a sluggish 2014.
Better incomes, a lower unemployment rate, low interest rates, and minimally improved credit conditions all helped in 2015. Low inflation probably contributed, too, as consumers continued to save, especially because of lower gasoline prices. We expect better wages and looser lending conditions going forward. This means that starts and permits should have another successful (if not better) year in 2016. A 10%-12% growth rate seems certainly feasible despite higher interest rates. Whether the economic impact will grow proportionately with the number of starts and permits is not so certain, as the mix of high-value versus low-value construction projects can significantly affect this equation.
Our Worries Over Manufacturing May Have Been Misplaced The manufacturing-only portion of the industrial production report managed another small month-to-month increase despite some extremely strong headwinds. Manufacturing-based industrial production increased 0.1% for November compared with 0.3% growth for October. This is the second monthly improvement in a row, and three of the past five months have been in positive territory. The data would look even better, five of six months up, excluding the auto sector and all of its convoluted seasonal factor adjustments.
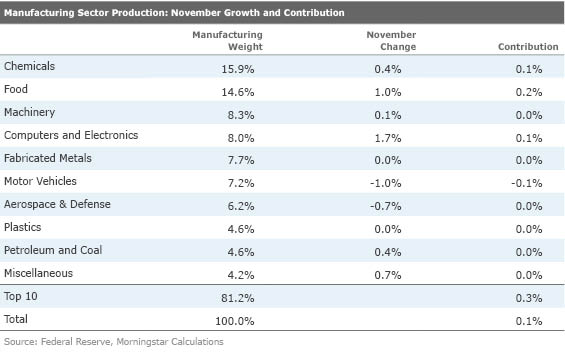
The month-to-month sector data, at least for November, does not support the general weakness theme or the narrative of slowing exports and a strong dollar killing the manufacturing sector. Of the 19 sectors that the report tracks, eight were up and eight were down, while three were unchanged. None of the five largest sectors were down in November (chemicals, food, machinery, computers, and fabricated metals accounting for more than half of the manufacturing sector).
Some of the weaker November categories had nothing to do with exports. Motor vehicle production was off 1% in November, after growing at double-digit annualized rates over the summer. Clearly neither the low November or the high summer auto numbers represent reality as it's hard to imagine auto production growing much faster than the year-to-date 6% growth rate in auto sales (year-to-date unit manufacturing and sales growth rates are nearly identical, supporting our faulty-seasonal-adjustment-factor theory).
Aerospace was weak in November, slowing 0.7%, most likely because of defense-related business and a lull in Boeing's civilian aircraft ramp-up process. Given the long sales cycle, we assure readers that current aerospace slowness has nothing to do with either a strong dollar or even slow overseas growth. Furniture was soft, too, but that probably had more to do with the slowdown in the U.S. real estate market (U.S. retail furniture sales were down in November, partly due to a summer slowdown in starts after a spring surge. Starts are now rebounding again as noted above). We don't believe much furniture is shipped out of the U.S., so exports and a strong dollar are not the issue.
In summary, we won't quibble with the fact that the manufacturing sector isn't nearly as strong as it was in 2014. However, sequentially things are getting better. The sector data also suggests that there are other manufacturing sectors that might pick up the growth baton for some of the commodity- and export-related sectors that were the stars of 2014. However, the key auto and aerospace sectors may keep a lid on manufacturing improvement, as those industries are showing signs of topping out.
Stepping back from the monthly data, year-over-year data continues to show slower growth rates, though a bottom is clearly in sight, even on the annual data.
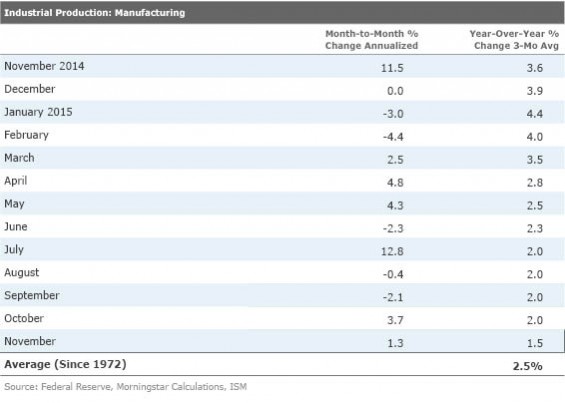
The last few months of 2014 were the best of the year. In December 2014, the manufacturing index reached its highest levels of the year at 105.9. The index then flatlined for six months, with a June index reading of 105.7. The November 2015 manufacturing reading is now 107.2, a 3.4% annualized improvement since June, hardly a business sector that is falling apart.
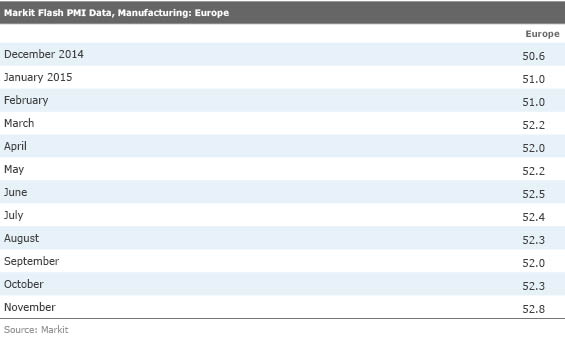
Europe's Manufacturing Sector Looks Stronger, Too The purchasing managers' manufacturing flash report showed a nice improvement for the eurozone, with the manufacturing index rising to its best level in 20 months at 53.1. Most individual countries, including Germany and even the periphery did well. Only France did poorly. Already in a soft spot, terrorist attacks in France certainly are not helping matters.
Current output and new orders, a more forward-looking metric, were at levels not seen in almost two years. Manufacturing employment improved for the 16th month in a row even if the rate of improvement was slightly less in December. When including services, employment growth readings are at their highest levels in 55 months, potentially providing more consumption growth and even more economic gains.
We thought some of the good numbers spoke for themselves but the text that went with the data was shockingly positive in tone. Clearly a combination of low prices, improving employment, low interest rates, and even some growth from recent immigrants is beginning to work its magic. Europe could easily be one of the big surprises of 2016.
Though China no longer provides flash data, the economic statistics from China were better this week as well. At the beginning of the week, retail sales and industrial production both showed modestly better-than-expected growth in November. Later in the week, it was announced that home prices also edged higher in most Chinese markets, allaying some fears of the potential for a collapse in China's housing market. After a period of year-over-year declines, prices were up 0.1% in October and 0.9% in November, with month-to-month price increases as well. China's housing market comprises approximately 15% of GDP versus just 3% in the U.S.
Consumption Report on Wednesday Should Prove to Be the Most Interesting New- and existing-home sales are due next week along with the final GDP revision for the third quarter and the consumption report on Wednesday. After a slow 0.1% consumption growth rate in October, we suspect that nominal consumption could grow by 0.3%-0.5%, and adjusting for deflation consumption could be up by 0.4% to 0.6%, with goods consumption sharply higher and service continuing to be depressed by warm weather and low utility utilization. If the consumption report is lower than expected, we would be looking to the utilities line for any funny business.
New-home sales and existing-home sales are expected to be relatively unchanged for November at 505,000 and 5.34 million, respectively. Holidays and large seasonal adjustments make it difficult to read too much into the next couple of months of housing data. We will be watching the regional data, too, as weather could help the data in both November and December.
The GDP revision is likely to prove a bit disappointing as a slightly lower services number (based on a recently released quarterly services report) along with yet another change in inventories has forecasters expecting the third-quarter growth rate to be revised down from 2.1% to 1.8%. We aren't too worried. Whatever we lose in the third quarter will likely be made up for in the fourth.

