
Is Inflation Finally Making Its Move?
A closer look at the data suggests inflation pressures are building faster than many had expected.

It was a great week for markets around the world, after last week's slump. Emerging markets did the best, gaining almost 5% for the week, while Europe pulled up the rear, but still gaining a healthy 2.4%. The S&P 500 was up over 3.5%. Bond yields were down and prices were up. Commodities were yet again the only big loser, off 0.8%. Inventory data later in the week had a depressive effect on oil prices.
Investors got comfortable with a December rate increase this week, with well over 70% of participants now believing that the first rate hike was likely to happen in December. Even the release of the U.S. Federal Reserve minutes on Wednesday didn't turn investors negative despite the hawkish tone. Paradoxically, we believe that markets now are thinking that if the Fed is so clearly signaling a rate increase, it must be seeing a stronger economy. Good earnings data, especially out of
The U.S. economic data was so tangled up this week that most market participants totally ignored what little data there was. Housing starts looked terrible, collapsing over 10%, but the more important permit and single-family data from the same report continued to show a slow but upward path. The housing data was certainly not good enough to create any kind of boom or even boomlet, though.
Likewise, industrial production headlines were terrible yet again and missed expectations. However, warm October weather, which held back utility usage, and mining data were behind the decline and disappointment. Manufacturing-only data was up a more acceptable 0.4%.
The Consumer Price Index seemed benign and on target, but a closer look at the services-only data suggests that inflation pressures are building faster than many had expected. No, we aren't going back to the 1970s any time soon, but the days of zero headline inflation are near an end, and we could flirt with 3% total inflation at some point next year.
Stronger CPI Data Takes Inflation Out of the Fed Decision Process After two months of back-to-back declines, headline CPI-based inflation for the single month of October was up 0.2%. Both single-month and three-month averaged year-over-year inflation was a meager 0.1%. Core inflation, which excludes volatile food and energy categories, was 1.9%, about the same as it has been for some time. Although the Fed favors the Personal Consumption Expenditures price deflator as its preferred measure of inflation, the fact that core inflation measured by the CPI has remained so close to 2% for so long suggests that a low inflation rate is not a reason to hold back a Fed rate increase in December.
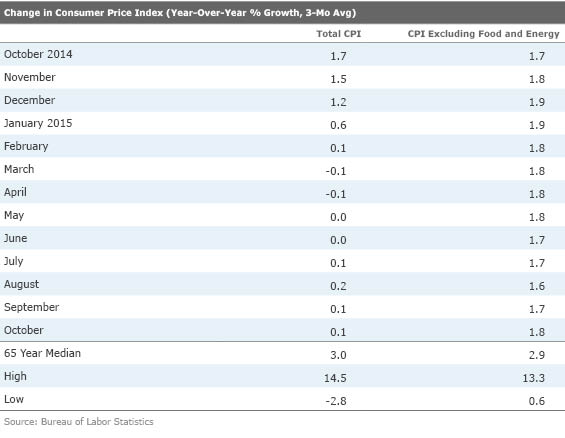
Although the headline and core CPI data looks modestly benign, some of that is a bit troubling, especially for some consumers.
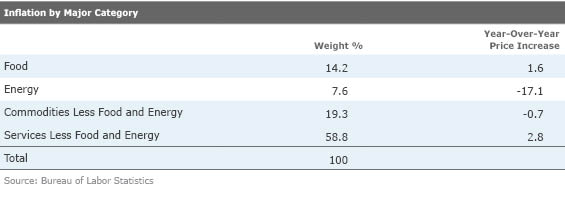
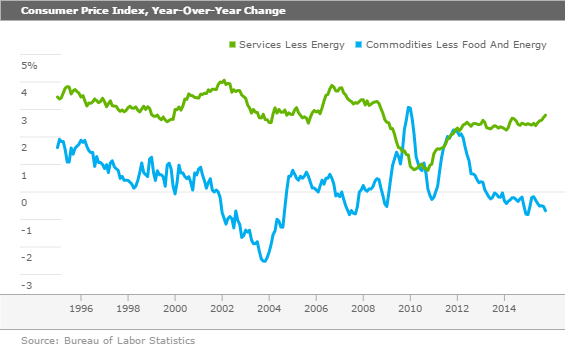
What is abundantly clear is that service inflation is becoming modestly troubling at 2.8% and that comprises a whopping 59% of the CPI. Shelter prices, which include rents, are up 3.2%, and rent prices by themselves are up an astounding 3.7%. Medical-related services are up 3% year over year, too. Tuition and child-care expenses are up 3.7% and veterinary fees are up 4.7%. A broad range of personal services, which includes haircuts, dry cleaning, and tax preparation, is up 2.9%. Even restaurant menu prices are up 2.9%. So prices in non-energy-related services have been anything but tame.
Energy price deflation is a well-recognized offset to that inflation. Less well-recognized is that prices for other goods are also declining and helping along the CPI calculation. Overall, goods prices are down 0.7% over the last year. Of course, a lot of goods are imported, and a strong dollar has given a strong whiff of price deflation for items that are imported. Outside of drugs, it is nearly impossible to find a single category of products that have increased in price. Furniture is down 1.4%, appliances 4%, apparel 1.9%, used cars 1.4%, and electronics 7.6%.
So who cares if service prices are up while goods and energy are down, and seemingly offset each other? First, there is the issue of widely varying inflation rates and the effects on different categories of consumers. Suburbanites who already own their homes, own a lot of cars, drive a good deal, and spend a lot of money on home goods are reaping a bonanza, inflation-wise. Meanwhile, older city dwellers living in apartments, driving less, owning fewer things and demanding more health-related services are getting shellacked by higher prices. This is why we often see a lot of comments on our column when we say inflation is low. It is also why this year's zero Social Security adjustment is most likely a raw deal for retirees, at least this year. In addition, given that renters, non-car owners, and people with a lot of health issues tend to be less wealthy, it compounds income inequality issues.
More worrisome is that all of this may mean that the levers to manage inflation are largely out of the Fed's control. If energy prices and food prices stabilize, headline inflation is likely to be in the 2% range, not the 0% that everyone is talking and worrying about. What happens in the fields and the oil patch can't really be controlled by the Fed, and at some point energy prices can't go down any more.
Turning to the core, the strong dollar is providing an incredible tailwind to nonenergy-related-goods price deflation. While the Fed certainly influences exchange rates through interest rate policy, the dollar could still weaken for other reasons (including poor fiscal policy, increasing trade deficits, and the calming of world fears). And that dollar weakness could translate relatively quickly into higher prices for the U.S. consumer, potentially further boosting goods and overall inflation even higher than the current 1.9% core rate. The labor shortage that we so often speak of is also likely to contribute to further price increases in the service category in the years ahead.
Again, I am not expecting a 1970s-style inflation binge, just slow continuing upward pressure in the headline inflation for most of 2016. Demographics, tight fiscal policies, and least a small output gap (currently) should keep things from getting out of control.
Manufacturing Sector Stabilizing The manufacturing sector has had a rough year thus far in 2015 after a strong year in 2014. A weak dollar, a strong energy sector, a rising housing market, and a stronger auto sector all contributed to the relative boom in 2014. This year energy, a poor commodities market (that means less machinery to process those commodities), and a strong dollar have all weighed on the manufacturing sector.
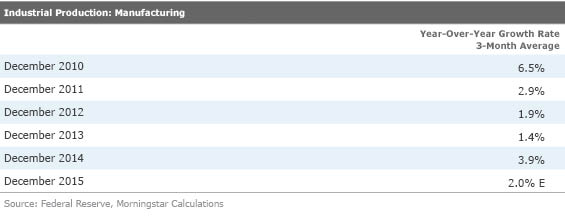
Year-over-year growth rates for manufacturing slowed dramatically from January until July before stabilizing. Now we can see that the year-over-year growth rate has stabilized at about 2.0%, although a strong close to 2014 limited any further improvement for a few more months.
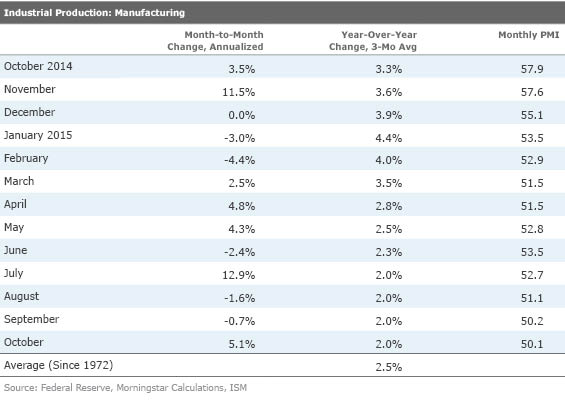
Although we are not fans of sequential, annualized data, we couldn't help but notice the improving quarterly trends. The first quarter showed a decline of 0.5%, the second quarter increased to 1.3% growth, and the third quarter to 3.2%. The single month of October annualizes to an even higher 5.1%, as shown above, showing more improvement. On a quarterly basis, 13 of 20 categories showed sequential improvement for the September quarter and 15 of 20 categories for the single month of October.
Headline Industrial Product Didn't Look Nearly as Good Generally, we go straight to the manufacturing sector and gloss over the mining and utility parts of the index. Lest we be accused of cherry-picking the data, we should note that the headline industrial production number declined 0.2% in October and is up just a tiny 0.3% year over year. Declines in both mining and utilities more than offset the manufacturing gains noted above.
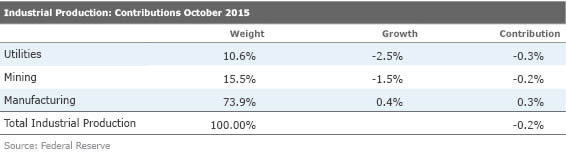
We tend to dismiss the utility numbers, because those are largely determined by weather and not by industrial demand, which is still generally trending down as industries become more energy-efficient. Furthermore, utilities don't change their employment based on weather. Low utility usage does depress consumption and the gross domestic product, but we tend to factor those out in those analyses. Mining has a more depressive effect, but is more indicative of world oil prices and special supply and demand factors, not general levels of economic activity. Also, oil not produced today is available for sale at a later date--it's not lost in a long-term economic sense, unlike an unused airline seat.
Interestingly, manufacturing is only 5 times bigger than the mining sector in terms of industrial output but employs 15 times as many people, so a slowing oil patch has less direct impact on employment than one might guess (although direct mining employment is down about 12% from its high of about 110,000 people).
Housing Data Yet Another Muddled Mess, Though the Industry Appears to Be Holding Its Own Last week we warned that housing starts might look a little weak. This week's were worse than a little weak, dropping a whopping 11% from 1.191 million annualized units in September to just 1.060 million units in October. However, year-over-year starts were down 6% and even less when you throw out some of the wackier seasonal adjustments.
Part of the issue with starts has always been the huge volatility in the smaller, less economically important multifamily sector. Single-family starts were down just 2.4% sequentially and showed a similar size increase compared with a year ago. The multifamily sector was down a much larger 25% following an 18% gain the previous month. Since the start of the year, multifamily starts have been up or down more than 10% in eight of 10 months. Weather and regulatory events can really move this data set around.
There are three things we can do to improve on the headline starts data. First we need to look at year-over-year, three-month averaged data. Next, we need to look at less-volatile permits data, and finally, we need to examine single-family homes separately from apartments.
Looking at year-over-year, averaged growth rates, the numbers generally trend better and are less volatile than the raw starts and permits data. Even that methodology failed briefly this summer when a New York City tax incentive drove all the housing data sets crazy. Eyeballing the data below, both starts and permits seem to be averaging in the mid- to high-single digits if you throw out the summer months. For the first 10 months of the year, growth rates in total starts are up 10.6% and permits by 11.9%, higher than the mid-single-digit trend because of the New York anomaly.
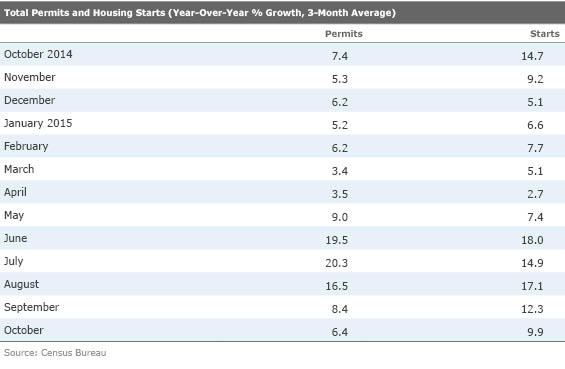
Because running to City Hall is a lot easier than pouring a foundation, permits are generally a lot more stable than starts. Of course, the New York situation temporarily blew out that normal rule of thumb. However, total permits have been relatively stable at just over 1.1 million units while starts have been all over the place. And permits actually increased from 1.1 million units in September to 1.15 million units in October. With the permits now comfortably ahead of starts (1.15 million versus 1.06 million), the housing industry is poised to close out the year on a good note, at least if the weather can hold up for a few more weeks.
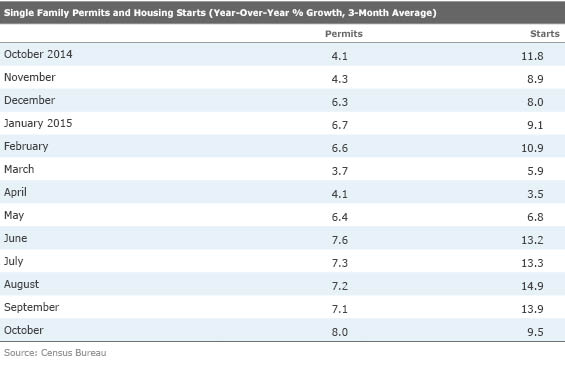
All Housing Starts Are Not Created Equal Although the total starts data gets all the headlines, it is single-family data that really moves the economic needle. With multifamily starts averaging in the 400,000-annualized-unit range and single-family units in the 700,000 range, growth rates in single-family homes will have a much bigger impact on economic activity by virtue of its sheer size. However, the story gets even better. In the official U.S. Bureau of Economic Analysis reports, which are done in dollars and not units, single-family homes are 4 times bigger in total dollars than multifamily homes, despite the fact that in units, single-family homes aren't even twice as large as the multifamily category. And the single-family category continues to improve at a tortoise-like pace, now running at about 8%, according to the permit data. The single-family should be free of the New York situation, making it a better representation of underlying growth rates.
The relatively slow improvement in housing data means the improvement can last longer rather than with a massive spike, which is often followed by a crash. Unfortunately, the rather small size of the housing industry and moderate pace of recovery is likely to limit the direct impact on GDP to 0.3%-0.4%, little changed from previous years but still terribly important in an economy that is growing only a bit over 2% in total. However, the housing industry is not the savior that will return the economy to the mythological 4% growth rate. It is just too small at about 3% of GDP.
Builder Sentiment Still Strong, Though Off Its Highs We aren't fans of a lot of sentiment stuff, but in the confused world of housing data, we are happy to have confirmation that the world is not falling apart. The builder sentiment report for October provided at least some small comfort with a reading of 62. That is the second-highest reading of this recovery and since all the way back to 2005. The only higher reading was a September reading of 65.
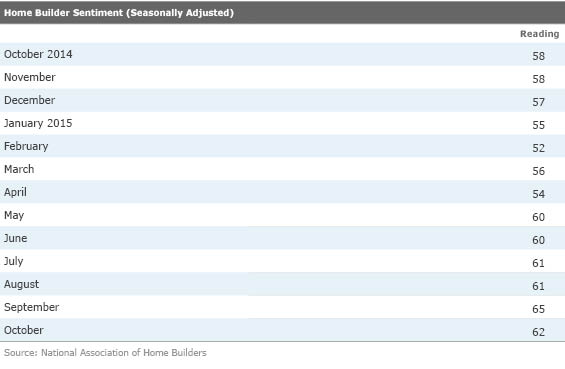
We also note that even in the boomtime 2000s era, the reading got above 70 only once. More reassuringly, the index dropped into the mid 40s in the first part of 2006, well before housing starts cratered and more than 18 months before we officially entered a recession. So the economy still looks safe on that front.
Housing, Manufacturing, GDP, and Personal Income Data All on Tap Next Week I am not expecting any of next week's data to do much for markets. I suspect improving new home sales will largely offset a decline in existing-home sales. The GDP revision should be small, especially given the new trade data release regime, and the revision should be upward given new inventory data. And personal income data and consumer expenditures are relatively well-known from already-released retail sales data and employment reports. Both should look more like longer-term trends and less like the poor September performance.
The flash world purchasing managers' report has been the single most market-moving activity every month this year with the possible exception of Fed announcements. With the world's fixation on China and its slowing growth rates in addition to questions about other Chinese data collection methods, this report is watched by just about everyone. However, beginning in September, the Chinese data source is no longer providing the flash data. However, the final data reading will be available the first week of December. As usual, flash data for Europe, the United States, and other countries will be available next week.
The European PMI reading has been stable for months at just over 52, indicating modest but uninspiring economic growth. The European reading is probably a winner either up or down. A down reading assures more QE, which Mario Draghi has been alluding to already, and a strong reading indicates a better-than-anticipated economy, but not strong enough to cause an early end to the well-loved QE program.
For the record, U.S. existing-home sales are expected to drop from 5.5 million units in September to 5.4 million in October. Sales have been outperforming pending data for some time and we, like the rest of the world, anticipate that this will come to an end in October. After so many months of outperformance, some pause is likely, perhaps even a larger drop than the consensus view.
On the other hand, new home sales, which seemed unexpectedly strong for most of the year, hit a speed bump in September. Expectations are for a quick rebound given starts data and the builder sentiment report. New home sales are expected to jump close to 10% month to month to about 510,000, which seems fine by us.
Consistent with a generally stabilizing manufacturing economy (except anything to do with commodities), the consensus is for durable goods orders to increase by 1.8% in October on the back of better airline orders. Even excluding transportation orders, durable goods orders are expected to be up 0.4%. We suspect that things could look even better. The two previous months of order declines look suspicious to us, suggesting a revision to past data or a barn-burner of a month in October. Again, markets aren't counting on much from the manufacturing sector given this year's relatively poor performance. Analysts won't believe a great number, and a bad number will be viewed as more of the same.
Given that we already have the retail sales data and a detailed employment report, it seems that the 0.4% increase in incomes and 0.3% increase in consumption that markets are expecting are well within range. Perhaps the only wild card is that low utility usage due to a record warm October could hold the report back by a tenth or so. A good number will start fourth-quarter consumption data off on the right foot. And given slowness in almost every other sector except housing, the economy is highly dependent on the consumer to come through in a pinch.
While some housing data was revised downward after the last GDP report, inventories are likely to be revised nicely higher. The net result is the GDP report for the third quarter is expected to be revised up from 1.5% to 2.1%. That looks just a tad aggressive to us, but the economy should get close to a 2% growth rate. October flash trade data, due next week, should give us some hints to the impacts of trade on the fourth-quarter GDP forecast (and if there is any meaningful trade revision in the third quarter). We suspect both exports and imports will look terrible, except maybe iPhone imports, effectively cancelling each other out in the GDP calculation.
/cloudfront-us-east-1.images.arcpublishing.com/morningstar/T5MECJUE65CADONYJ7GARN2A3E.jpeg)
/cloudfront-us-east-1.images.arcpublishing.com/morningstar/VUWQI723Q5E43P5QRTRHGLJ7TI.png)
/d10o6nnig0wrdw.cloudfront.net/04-22-2024/t_ffc6e675543a4913a5312be02f5c571a_name_file_960x540_1600_v4_.jpg)