
Are Junk-Bond ETFs on Track?
Common measures of tracking performance don't tell the full story.

The two most popular junk-bond exchange-traded funds,
An important point that has come up time and again in this rivalry is their relative tracking performance. On the surface, there seems to be a large discrepancy between the two ETFs in how well they track their respective benchmark indexes.
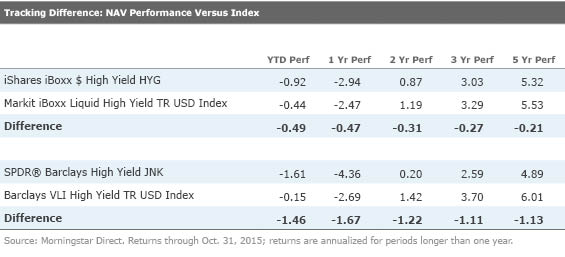
The table below compares the net asset value returns for HYG and JNK against the returns of their respective benchmarks over different periods. Based on these figures, HYG appears to be a clear standout.
In fact, after adjusting for its 0.50% expense ratio, HYG actually outperforms its benchmark on a gross basis. On the other hand, JNK appears to lag its index by a relatively wide margin--a gap far too large to be explained only by its 0.40% expense ratio.
Even though HYG is pricier than its chief rival, it appears to have tracked its index much better than JNK. Despite its higher price tag, HYG could actually be considered cheaper overall from a total cost of ownership perspective.
Portfolio Check Given that they track unique benchmarks, there are differences--in terms of portfolio construction and economic exposure--that, of course, should be considered along with cost and tracking efficiency. These factors help explain why performance between HYG and JNK will vary. The tables below provide a breakdown of some of the key differences between the two portfolios. But in terms of the rules governing index composition, both benchmarks have strenuous liquidity constraints. JNK's benchmark sets the bar for the minimum outstanding face value of a bond at $500 million, even higher than the $400 million limit set by HYG's index.
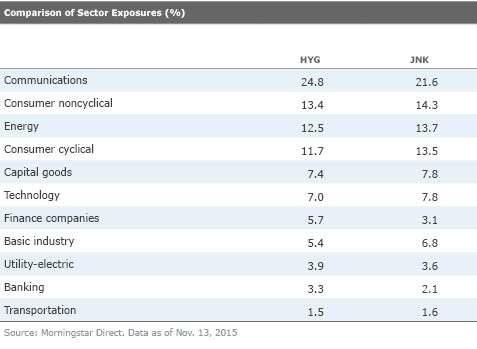
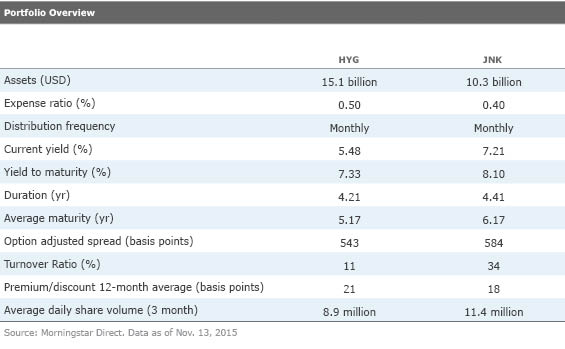
The funds offer similar exposure to the same asset class. As shown in the tables above, there are some slight differences, but nothing jumps out as significant enough to explain the tracking discrepancy. So what is it? Are iShares' portfolio managers that much more skilled? Perhaps State Street just happens to be lousy at indexing high-yield bonds?
The answer actually lies deep in the fine print. As it turns out, the discrepancy in tracking error may largely boil down to a subtle difference in how the indexes are calculated. To be clear, I'm not referring to the composition of the benchmark (that is, which bonds are included and at what weighting), but rather how bonds in each index are priced. The price at which a bond enters or exits the index is a critical detail. The same goes for when existing constituents are bought and sold in the monthly rebalancing process.
The index JNK tracks, the Barclays High Yield Very Liquid Index, prices all transactions at the bid price (which has been the industry standard historically). HYG's benchmark, the Markit iBoxx USD Liquid High Yield Index, also marks existing and exiting bonds at the bid price, per the industry standard. But unlike most other fixed-income indexes, it marks new holdings that are entering the index at the ask (offer) price.
This technical detail helps explain why JNK's tracking error has been so much larger than HYG's. In effect, by pricing incoming bonds on the ask side, transaction costs are embedded in the Markit index that HYG tracks. As a result, HYG should be expected to have minimal (if any) tracking error. In contrast, JNK would be expected to lag its benchmark by (at least) its transaction costs, given that Barclays index does not reflect the cost of the bid-ask spread associated with actually buying and selling a particular bond. Theoretically, a portfolio that fully replicates its index, holding for holding, and matches every rebalance and reconstitution should be expected to trail its benchmark by an amount equal to its transaction costs.
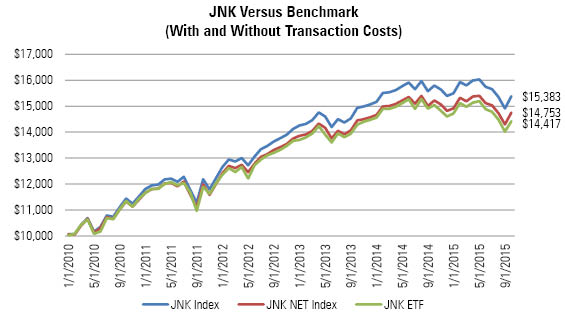
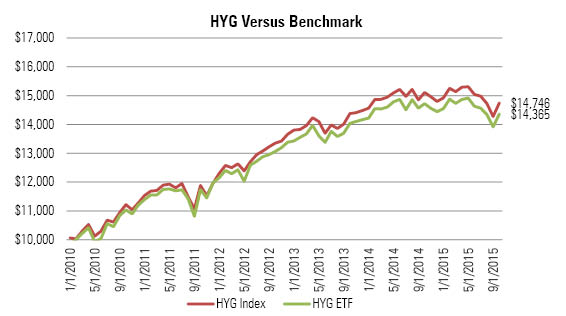
Since Barclays also calculates a version of the index that includes transaction costs, it is possible to make a more direct apples-to-apples comparison. The chart below shows the performance of JNK versus both versions of its benchmark. Compare that against the chart showing HYG against its benchmark index. From this view, both ETFs appear to tightly track their benchmarks.
- Source: Barclays, SSgA, Morningstar Analysts
- Source: Morningstar Analysts
As can be seen in the charts above, once the playing field is leveled, both these funds have tracked their benchmarks reasonably well. ETFs are often judged by how well they track their indexes--but not all indexes are created equal. In this particular case, the devil is in the details.
Disclosure: Morningstar, Inc.'s Investment Management division licenses indexes to financial institutions as the tracking indexes for investable products, such as exchange-traded funds, sponsored by the financial institution. The license fee for such use is paid by the sponsoring financial institution based mainly on the total assets of the investable product. Please click here for a list of investable products that track or have tracked a Morningstar index. Neither Morningstar, Inc. nor its investment management division markets, sells, or makes any representations regarding the advisability of investing in any investable product that tracks a Morningstar index.
/cloudfront-us-east-1.images.arcpublishing.com/morningstar/T2LGZCEHBZBJJPPKHO7Y4EEKSM.png)
/d10o6nnig0wrdw.cloudfront.net/04-18-2024/t_34ccafe52c7c46979f1073e515ef92d4_name_file_960x540_1600_v4_.jpg)
/d10o6nnig0wrdw.cloudfront.net/04-09-2024/t_e87d9a06e6904d6f97765a0784117913_name_file_960x540_1600_v4_.jpg)