
U.S. Economy Much Stronger Than Believed
The quality and size of the second-quarter GDP upgrade was far better than anyone could have hoped for.

It was a wild week for the markets, with powerful downward movements in most world equity markets early in the week followed by equally impressive gains at the end of the week. Early-in-the-week losses were a carry-through from poor end-of-week action the previous week. Some markets could not act on last week's bad news because of time zone differences.
Fear of slow Chinese growth and their seeming inability to stop the decline (in both stock markets and economic activity) despite pulling out just about every stop over the past several months has been weighing on Chinese and other emerging markets for weeks. Those worries seemed to come to a head at the beginning of the week, compounded by pricing (some funds and exchange-traded funds in the U.S. could not be priced during the day on Monday) and liquidity issues on Monday.
However, strong U.S. economic data combined with one Federal Reserve governor's statements that the case for a September rate increase was not compelling set off an epic stock market rally on Wednesday of more than 600 points, the best since 2011. Overall, most developed markets were up 0.5% to 1.0% for the week, while truly pummeled emerging markets finally did even better, increasing over 3% for the week.
Better U.S. growth potential also caused commodities, especially oil, to boom. Overall, commodities gained 3% for the week. Stronger growth and better markets at the end of the week caused the interest rate on the U.S. 10-year Treasury bond to increase from 2.05% to 2.19%, despite a more dovish tone out of some Fed governors in the middle of the week.
U.S. economic news was amazingly good, with highly positive news on GDP growth in the second quarter and strong housing reports in July, confirming that last week's strong housing reports were no accident. The GDP report for the second quarter was revised up to a surprisingly strong 3.7% from just 2.3% in the previous report just one month ago.
Although some GDP revision was expected, the quality and size of the upgrade was far better than anyone could have hoped for. Apparently that strength continued into the first month of the third quarter. Consumption and income growth were also still quite strong in July, equaling June's growth rate despite upward revision to the June and especially May data. Even manufacturing, which has been having a hard time regaining its footing, showed surprising sequential strength in the durable goods new order report.
The news was good enough to convince us that the U.S. has a serious chance of growing more than our 2.0% to 2.5% growth rate for all of 2015, exceeding Fed expectations of 2% or less. However, inflation remained incredibly low, with sub-1% year-over-year inflation growth. Even throwing out food and energy, inflation remained just above half the Fed's target of 2%.
GDP Report for the Second Quarter Stunningly Good Expectations for the second reading of the GDP report were exceptionally high at 3.3% inflation-adjusted GDP growth, but the U.S. Bureau of Economic Analysis still managed to surprise everyone with a reading of 3.7% growth.
To be sure, part of the strong increase in the second quarter was because of the abysmal first quarter, when the economy grew just 0.6%. Still, averaging the first and second quarters together, growth in the first half was over 2%, not bad for all the world drama.
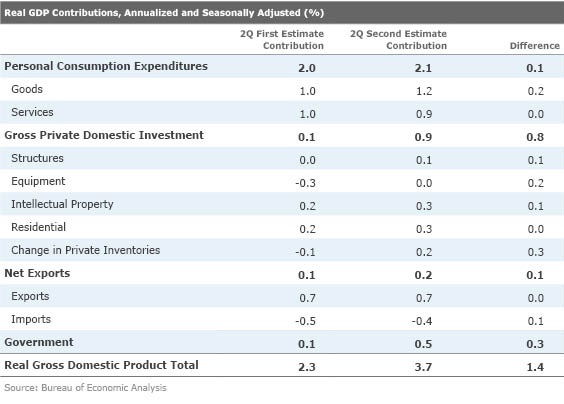
More importantly, inventory revisions were not the core of the GDP revision, as many economists had feared. Most economists had expected inventories to add 0.5% to the GDP growth rate instead of subtracting 0.3% as they did in the first estimate. If correct, this would have meant inventory adjustments would have accounted for 0.8% of what was expected to a total revision of 1% (2.3% to 3.3%). That had economists yawning over what would normally be considered a huge revision because inventory swings in either direction are normally reversed in subsequent quarters. Instead, the inventory contribution revision accounted for just 0.3% of a larger-than-expected total revision of 1.4%. Note that most every category was revised upward, and the three items that were not revised were all unchanged from the previous estimate. There were no downward revisions.
Furthermore, the sector analysis of the report was even more stunning, with an exceptionally balanced performance across almost every category. We usually just show the contribution to GDP growth by type, but this week I wanted to highlight individual category growth rates and what percentage of GDP they comprised. And by multiplying growth by the percentage of GDP that it represents, we obtain the overall contribution. Adding all the contributions together produced the total GDP growth rate. Note that at 68% of GDP, it is very hard for consumption not to dominate the calculation. Exports is the only other subcategory category to crack into double digits in terms of importance.
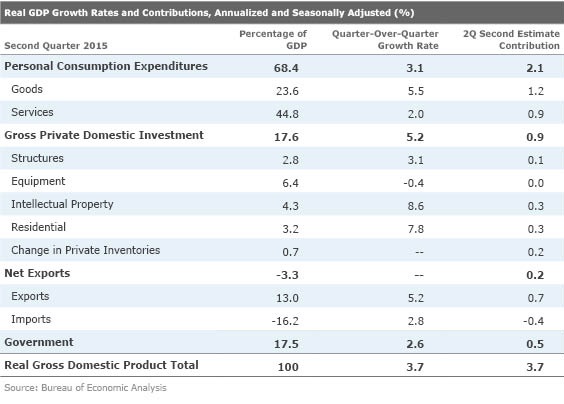
Growth by category (the second column above) was unusually balanced, with growth rates ranging from 2% to 9%, excluding the equipment category, which shrank modestly. Even the equipment category would have shown growth if it had not been for the dismal performance of oil-related equipment. Consumption was strong, business-related spending was modest, housing did well, government was a contributor for a change, and net exports, despite a strong dollar, managed to be a positive overall contributor to GDP growth.
Subsequent reports for July (auto sales, consumption, durable goods, trade balance) all suggest that some of the strong momentum of the second quarter has been maintained at the start of the third quarter. We now believe that full-year GDP will come in at the high end of our 2.0%-2.5% range. The performance in the back half of the year will not need to be as strong as we had feared to get to the high end of the range.
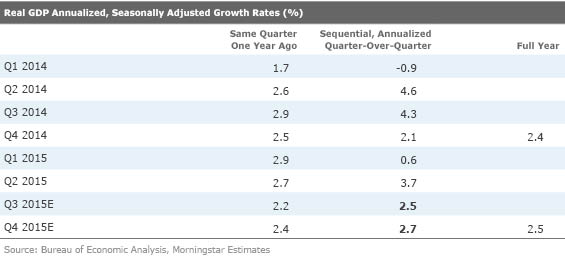
Volatile Quarterly Data Hides a Stable Pattern of Growth Although the sequential quarterly data was excellent, the same quarter compared with the same-quarter growth rate remains remarkably stable. Same-quarter growth is even stronger than our full-year growth rate, at least until we get to the really tough comparisons in the third and fourth quarters. Just looking at the plethora of great data from July, the temptation is to even raise our growth estimates. However, one month is a small sample of a quarter, and world turmoil might tamp things down a little around the edges. But so far so good in terms of third-quarter performance, which we will detail below.
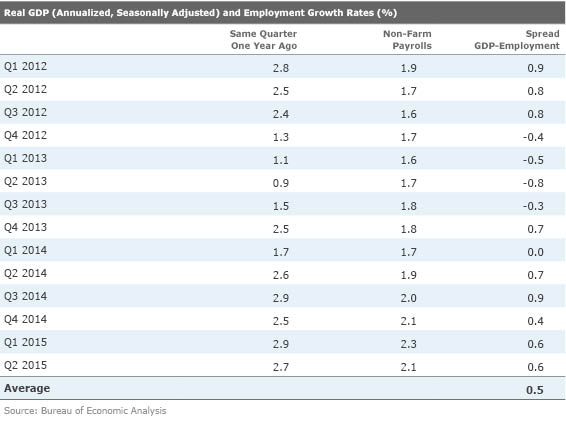
Productivity Growth Isn't Where We Would Like to See It The recently revised GDP report helps widen what was a very narrow gap between employment growth and GDP growth. The spread is now in favor of GDP growth by 0.6%, which is ever-so-modestly above recent averages of 0.5% but below longer-term averages that are closer to 1%. We would like to see the gap widen a little more, and I expect to see a modest widening in the back half of the year as employment growth slows faster than GDP growth year over year. Low productivity has helped hold back growth and is a major concern of the Federal Reserve.
Personal Income and Spending Do Well Considering Upward Revisions to Old Data Personal income and real disposable personal income grew 0.4% and 0.5%, respectively, exceeding more modest consumption growth of 0.3%. Meanwhile, inflation as measured for this report was just 0.1%, which pulls down all of the growth rates by 0.1%. The battle between incomes and spending continues, with income growth exceeding spending growth for two months in a row after a period where consumption was winning out.
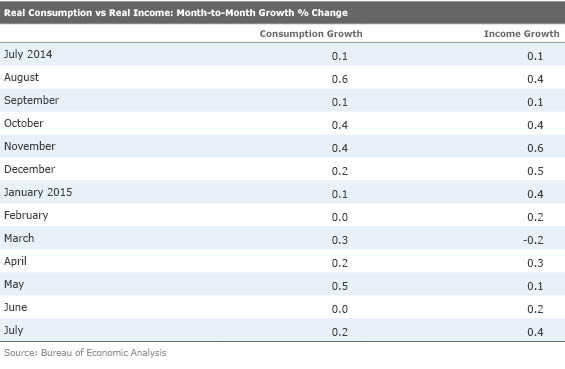
In the more stable year-over-year averaged data, consumption growth and income are now in very close proximity. The income data is the most comprehensive measure of what is available for spending, but wage data is more quickly spent than other types of income (dividends, rents, business income). Wage growth, due to a hiring binge late in 2014, is still running ahead of consumption, suggesting that there is more room for consumption to expand, especially now that oil prices are on their way back down. Note that both wage and income data diverged from consumption early in this recovery as consumers navigated around potential tax increases and shifted incomes around due to tax law changes. With the tax changes now in the rear-view mirror, incomes and consumption have tended to move together, with consumption generally not as volatile as incomes. The close relationship and stable trend suggest a very consistent consumer who has not been spooked by world events.
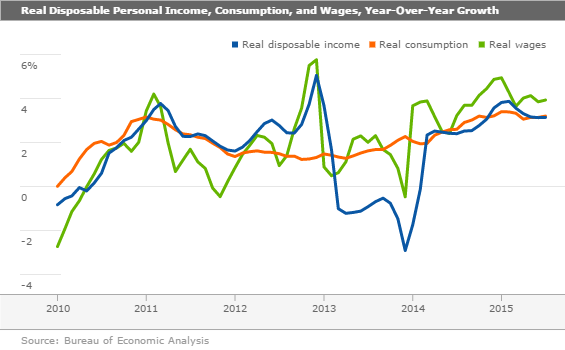
Year over year, both consumption and real disposable income have been growing on average at just over 3%. In fact, since last September, consumption has varied little, with a high of 3.4% growth and a low of 3%. You would hardly know that from the press reports of extremely volatile month-to-month data.
July also appeared very consistent, with continued 3% or more consumption growth for the third quarter. The headline consumption growth for the single month of July was 0.1% lower than anticipated at 0.2%; however, considering previous months were revised higher and cool weather depressed utility usage, we were pleased with July's consumption number, which wasn't that bad anyway. Month to month consumption growth would have been 0.3% instead of 0.2% if utility usage had just remained flat in July instead of shrinking. July consumption was particularly strong in the long-lasting, big-ticket goods categories that suggest consumers' attitudes toward the future are improving. Cars, furniture, and recreational goods all showed exceptional performance in July.
We Are Not Expecting a Consumption Slowdown in August We don't think July was a one-time event,either. Early reports from the auto industry suggest that August car sales will again be well over a 17 million unit annualized run rate.
Also, weekly shopping center data through Aug. 22 doesn't look much different than July's even with all the market turmoil. The housing market, which has been picking up steam since early spring, should have knock-on effects on the economy, including expenditures on furniture and remodeling supplies.
More Signs of Stabilization in Manufacturing The headline number for durable goods orders, a key forward-looking indicator of economic activity, was surprisingly strong in July, moving up 2.0% versus expectations of a 0.6% decline. Even excluding the transportation sector (mainly aircraft and cars), orders were up 0.6% month to month. The recent improvement in month-to-month data should eventually pull up the year-over-year data, which is still in decline. The improving trends in both the month-to-month and year-over-year data persist even when we run the data through a three-month moving averaging process.
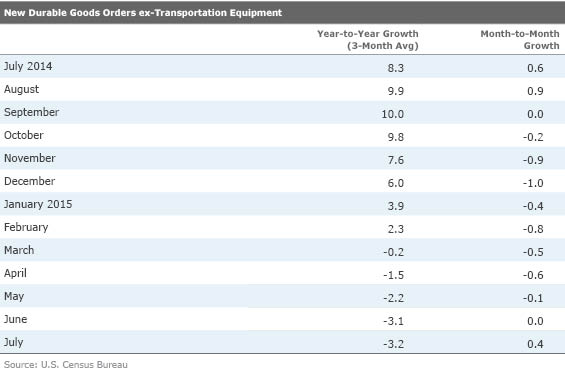
The positive order data was also quite broadly based, with four of the six non-transportation-related categories showing single-month gains of more than 1%. The metals categories, primary and fabricated metal products, were the only two nontransportation categories that were in decline. Metals are taking the brunt of the effect from a slowing market for commodities in general and in China in particular.
However, given renewed declines in oil prices and even more issues in China, future months may not be as good as July. It's not helping that a lot of manufacturers underestimated their exposure to the energy industry, either. For manufacturing, it's a question of whether housing and perhaps the consumer offset the effects of much softer commodity and emerging export markets. We are still optimistic that the manufacturing sector will be back in growth territory by year end, but it looks like a closer race than we had been anticipating, despite this week's good news on durable goods orders.
Trade May Not Be a Big Hindrance to GDP Growth The noninflation trade deficit fell from $62.2 billion in June to a smaller $59.1 billion in July, which was much more shrinkage than expected. We wouldn't read much into this report until we see inflation-adjusted and sector data in next week's more complete trade report.
With the U.S. growing much faster than the rest of the developed world, it was still surprising to see the deficit near its lowest level of the last 12 months. The report leaves the impression that perhaps it is too good to be true. While exports were up an anemic 0.4% month to month as one might expect (though falling energy prices are likely holding back nominal growth), imports into the world's largest economy were down 1.4%, which just doesn't make much sense. A sharp rise in auto exports after months of softness seems particularly suspicious. If the data proves to be true and is unrevised, it would suggest that trade could again help the GDP calculation in the third quarter.
Housing Momentum Is Real by Roland Czerniawski This week's forward-looking housing reports support our thesis of a sharply improving housing market. The new evidence this week included new-home sales and pending home sales. The new-home sales report, in particular, offered some bullish clues indicating that the housing momentum is real and should continue in the months ahead.
On the home price front, the news was also good, suggesting that the streak of large monthly increases appears to be moderating as June's data showed more modest monthly price growth. Housing has already provided a large boost to second-quarter GDP, but it looks like the third quarter is off to a good start, providing hope that housing's substantial contribution to the GDP calculation could be sustained.
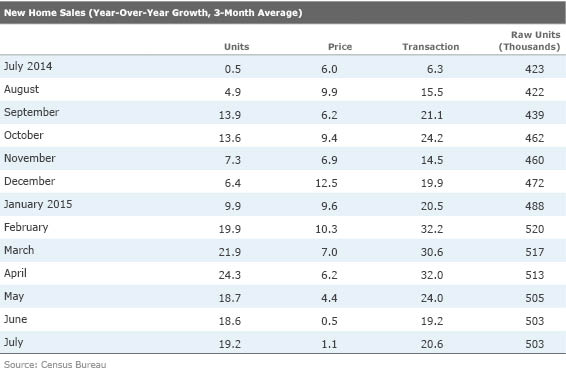
New-Home Sales Reaffirm the Housing Strength After the series of strong housing reports last week, new-home sales confirmed that the housing momentum continues across different segments of the industry. July's sales of new homes advanced to 507,000 units annualized or 5.4% growth from the previous month. Year-over-year the growth rate stood at 25.8% for the single month of July, or 19.2% when averaged for three months.
The average selling price increased significantly month to month due to the better-than-usual sales of high-end homes, but year over year, the new-home price growth remains fairly moderated. Inventory of new homes available for sale was up, too, reaching the highest level since 2010. It is definitely good to see that inventories remain healthy, especially considering the recent pickup in housing activity. The new-home industry has been battered by notoriously low inventories since early 2011. Having adequate inventory levels is crucial to sustaining the current housing momentum and preventing a surge in prices.
Regionally, the Northeast, after lagging for many months, now appears to be undergoing, at least temporarily, a housing boom. All housing reports this month pointed to much-higher-than-average single-family growth there, and new-home sales in July were not any different, with a 23.1% month-to-month surge. The South and West were strong, too, while the Midwest contracted 6.9%.
Hidden in the details was another piece of good news. The sales of homes for which construction has not yet begun surged almost 20% month to month and 48% year over year. Those are sales of homes that are typically not yet accounted for in the starts and permits data, and provide a lot of dry powder for future housing activity and related industries such as furniture and home improvement. This means that the housing momentum might very well continue into the future months.
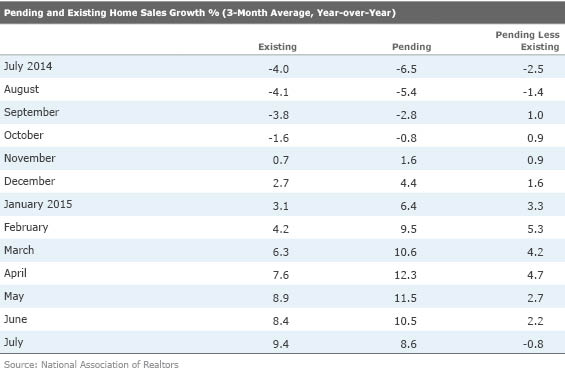
Pending Home Sales Activity Remains Healthy Pending home sales index advanced 0.5% in July, while year-over-year growth stood at 7.4%. The year-over-year growth trend seems to be moderating after a four-month streak of double-digit growth. July's reading, while not growing as fast month to month as earlier this year, still indicates a healthy market for existing-home sales down the road.
We've come a long way since 2014, where the year-over-year growth was in deep negative territory. Like many indicators, it feels like the housing market is easing into an 8% to 10% annual growth rate. Regionally, the Northeast reported the strongest growth in pending activity (4.0%) while the South--by far the largest housing region--advanced 0.4%. The Midwest was flat, while the West contracted 1.4%. Overall, on a year-over-year basis, all regions appear to be growing at a healthy rate, ranging from 5.7%-12.1%.
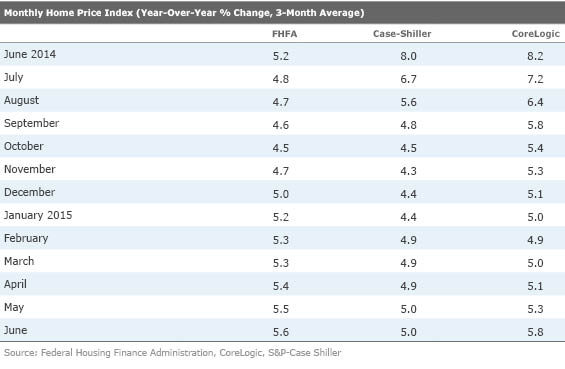
Home Price Growth Still in Moderate Territory This week's home price reports from the Federal Housing Finance Agency and Case-Shiller seemed to point to some moderation in home price growth. Case-Shiller was down 0.1%, while FHFA, which only tracks prices of homes with higher-quality government-sponsored enterprise mortgages, increased 0.2%.
After a series of consecutive monthly price increases, we were worrying that the year-over-year price growth might be heading to above 6.0% territory. This scenario still cannot be ruled out, but June's data (with the exception of CoreLogic) showed relatively moderate increases. Considering that the inventory levels of existing homes have stagnated in recent months, some temporary pricing pressures may still lie ahead. Nonetheless, our forecasts predict 4.0%-6.0% home price growth in 2015, a rate that we think is optimal for sustaining the current housing recovery without causing a large dent in the housing affordability.
Next Week Brings a Lot of Data; Focus Should Be on Autos and Employment The consumer is king in the U.S. economy, and next week's report on August auto sales will help determine what kind of mood those consumers are in.
Expectations are relatively high, with annualized sales of 17.3 million-17.4 million units expected. That compares with a very strong 17.5 million units in July, though August will be aided by having five Sundays, which tends to boost the seasonally adjusted data. However, growth won't look as good compared with last year, which saw sales of 17.2 million units. Last year was aided by an early Labor Day weekend that fell entirely in the August report. This year, Labor Day sales will fall in September.
The August employment report is easily the most accident-prone and most seriously revised reports compared with every other month. And almost all those surprises have been negative. We have actually had several sub-100,000 job-addition reports and even one employment decline over the past several August reports (at least on the first report prior to revisions). However, many of those problems were subsequently revised away.
It's too bad that this often fluky report is the last major employment report before the Fed's next meeting. Most economists seem to believe the government statisticians now have it all figured out for this year. Expectations are for job growth of 223,000 people added in August, which isn't much different than last month's 215,000 jobs added. I have to admit that all the strong economic data recently combined with some decent alternative employment data suggest a very normal month. Still, I have a lot of scars from past August reports that keep me from going out on a long limb. And if the data is very bad, the odds are high that it will be erased away anyway.
/cloudfront-us-east-1.images.arcpublishing.com/morningstar/T5MECJUE65CADONYJ7GARN2A3E.jpeg)
/cloudfront-us-east-1.images.arcpublishing.com/morningstar/VUWQI723Q5E43P5QRTRHGLJ7TI.png)
/d10o6nnig0wrdw.cloudfront.net/04-22-2024/t_ffc6e675543a4913a5312be02f5c571a_name_file_960x540_1600_v4_.jpg)