
Will August Upset the Fed's Applecart?
After July's boring jobs data, the unpredictable August report remains the last major impediment to a September rate hike.

With so many down days in a row for the U.S. markets, I opened my weekly markets spreadsheets with some trepidation. I was somewhat surprised that the S&P 500 was down only a little less than 1.3% and Europe was virtually unchanged. Only emerging markets took a hit, but were still down just over 2%, which isn't terrible compared with the recent past. We are not sure which is cause and which is effect, but at a 1.9% decline commodities where down about the same amount as emerging markets. (A lot of emerging-market economies depend on commodity exports.) Oil prices continue to struggle, which might also explain why world equity markets in general did not have a great week. The correlation between market performance and oil prices has been growing in 2015. Fed worries generally pushed up bond yields, with the U.S. 10-Year now yielding 2.27% versus 2.21% a week ago. Most other bond yields were also modestly higher on the week.
The bulk of economic news was in Goldilocks territory of not too high and not too low. Employment data was straight down the center of most forecasts, with a middle-of-the-road, plain-vanilla performance. Auto sales were surprisingly strong, without some of the smoke and mirrors from government statisticians that have been obfuscating recent results. Auto sales growth for all of 2015 may not drop from the 5% level of 2014 that had been widely expected at the end of 2014 and as recently as a couple of months ago. The ISM purchasing managers' report looked a little soft for July, but a closer look at the report suggests manufacturing strength and not weakness, and new orders accelerated sharply as did several other components. Complete trade data for June looked a little soft, but that was fairly well known last week with the government's new early warning system for the trade deficit. This may help limit massive GDP revisions in the future.
Unfortunately, the combination of decent economic news and a weaker bond market heated up concerns that the Fed would indeed raise rates in September, probably leading to the drumbeat of equity market declines, with the Dow now down seven straight sessions. It makes for great headlines, but on a percentage change basis it was a relatively tame week that doesn't come near the top 10 of bad weeks this year.
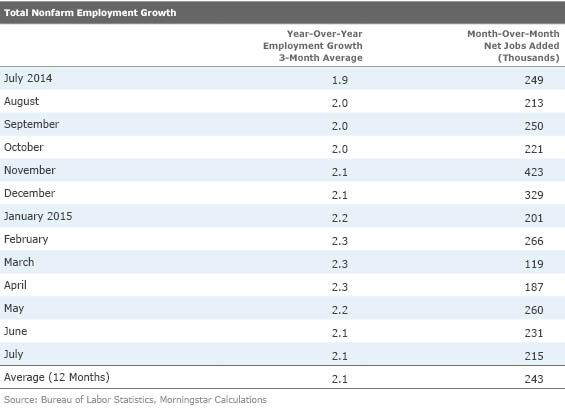
Employment Report Mercifully Boring According to the BLS the economy added 215,000 jobs in July, close to the consensus estimate of 220,000 jobs. The pace was a bit off of the 249,000-per-month pace of the past 12 months, which we never viewed as sustainable. Two barn-burner months at the very end of 2015, especially the 423,000 jobs added in November, are still having a dramatic impact on the averages. Also, the revisions to the prior two months were minimal. After a big drop in June, the unemployment rate remained steady at 5.3% even as the labor force increased by more than 100,000 people.
This headline data should be enough to keep the Fed on pace to raise interest rates in 2015, most likely as early as September given that the employment market looks healthy and inflation is moving slowly toward the Fed target. However, the July data, which is relatively stable with small seasonal adjustment factors, was never really our worry in terms of derailing the Fed.
It is the August report, which will be the last report to come out before the Fed's September meeting, that remains the last major impediment for a September rate hike. The August jobs report has been a very rough one over the past several years. This has been especially true for the first version of the August labor report, with subsequent revisions eventually eliminating some of the shortfalls. One recent report actually showed a job loss on the first cut and just last year the originally reported August data was below 100,000 jobs. If this August's job report shows 150,000 or fewer jobs added, the Fed may choose to delay action at its September meeting. If the report is better than that, we believe the odds of a rate hike in September are high. Again, it seems extremely likely that rates will be increased in 2015, but exactly which meeting that happens at is largely irrelevant to the longer-term outlook for the economy.
Year-Over-Year Employment Data Shows More of the Same Growth in nonfarm payrolls on a year-over-year averaged basis remains at 2.1%, which is just a tad higher than what we might suspect given year-over-year GDP growth of 2.4%. Recently the spread between GDP growth and employment growth has averaged 0.5% and the longer-term average is about 1% or so. Again, observe the relatively stationary year-over-year average employment growth rate and the hyperactive month-to-month data featured in most media reports.
Hourly Wage Growth and Hours Worked Compound the Employment Picture As we often point out, employment growth is only part of the more important total consumer income growth figures. Growth in our wages and hours worked is equally important. In a pleasant surprise, hours worked for July increased by 0.1 to 34.6, the first time we have seen an increase in this metric in many months (which is typical of the middle portion of a recovery). Growth in hours is often followed by growth in overall employment as businesses try to bring down overtime and avoid employee burnout. An alternative reason for growth in hours worked could be that businesses can't find enough qualified workers at the wages they are offering. This month showed modest growth in hourly wages following a penny decline the previous month. The wage picture is a little clearer year over year, as nominal wages seem to be stuck in a low 2% growth rut, despite the ups and downs of inflation. The data below reflects just the private sector data because government data on hours and hourly wages are not generally available.
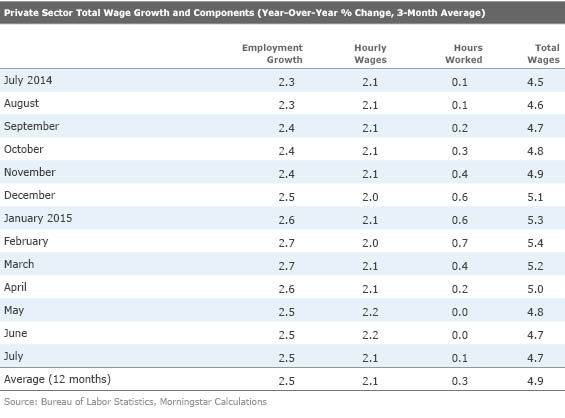
Combining all three factors, overall private sector wage growth is still a relatively high 4.7% (it's still 4% even when the slow growth government sector is added in) which should be enough to fuel a lot of consumer spending, especially because inflation remains close to zero. Though the trend appears to be down, I caution that the exceptionally strong and unsustainable numbers at the end of 2014 and the opening months of 2015 skewed some of the data artificially higher. Though it was nice to see total wage growth of over 5% for several months, I would be very happy with inflation-adjusted, private sector wage growth 3.0%-3.5%.
Temporary Help and Mining the Only Big Sector Disappointments Temporary help and mining were the only two major sectors to see declines in July. The mining sector, which is being driven by the oil sector, lost 5,000 jobs, which is still better than 14,000 jobs lost each month between February and April. Recent declines in oil prices may worsen those losses in the months ahead. The falling temporary help sector is a good news/bad news story. The good news is that consumers prefer regular jobs than temp jobs and are more likely to spend permanent wage income. Also, it shows more business confidence if businesses are choosing full-time employee over temp workers. The bad news is that temp workers are often an early warning sign of employment weakness as employers fire temp workers while keeping full-time workers. Poor temp hiring often means poorer overall employment data in the months ahead. Also, while still up, the health-care sector added just 30,000 jobs in July, compared with an average of 45,000 over the past 12 months. Most likely this is just another one of the seasonal blips, but it is a trend worth watching. Government hiring also remains in the dumper. On a year-over-year basis government hiring is up just 0.3% compared with private sector hiring growth of 2.4%, a spread that has no historical precedent. Stingy government trying to limit its debt load and increasing transfer payments (pensions and health care) as well as some outsourcing have severely limited a sector that accounts for nearly 15% of all employment. While one can argue whether that is a good thing or a bad thing, low government spending has been one of the real limiters of total employment and economic growth.
There weren't any sectors that one might classify as outstanding, but the financial services (led by the Fed and the insurance industry), professional and business services (excluding temps) and retail added above their 12-month averages. While it makes for a boring column, the job growth for July was unusually balanced.
Income and Consumption Report Suggests There Is More Room for Higher Consumption Every month we struggle with this report. We love it because it is the only report that adjusts all the data for changing prices, which is a really big deal recently. Shifting inflation rates play real havoc with looking at various retail sales reports. Electronic sales, which almost always shrink month to month in most retail sales reports, suddenly turn into nice increases when the official price adjustments are applied to the consumption report. And this report is one of the few to roll services into the consumption picture, though I fear the first estimates of services aren't a lot more than trendlining. And with consumption representing close to 70% of GDP, an estimate of consumption can get one relatively close to a GDP estimate.
Still, this report is stale by the time it comes out. We already have auto sales and some manufacturing reports as well as some weekly retail sales reports for July before the June report was even issued. Also, newspapers tend to report the highly volatile month- to-month number that gets all caught up with really volatile, often revised month-to-month numbers and often forget to even mention the inflation-adjusted numbers. A really good piece of consumption news is almost always followed by a bad piece of news, which makes for much drama that creates a media feeding frenzy. Yet the year-over-year numbers, even unaveraged, are paragon of stability, at least compared with the yo-yo of the month-to-month numbers.
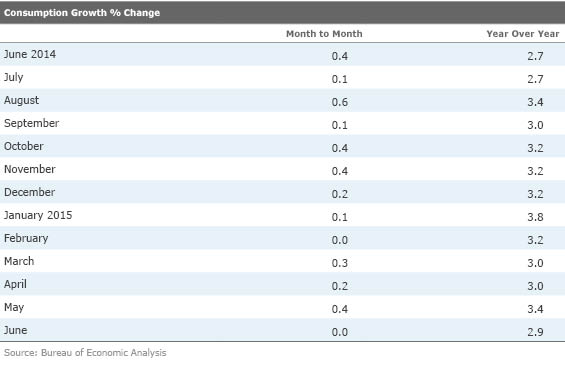
The good news is that the year-over-year consumption data has crept up over the past couple of years from our benchmark of 2% to close to 3% (with a few weather-aided months that were even better, but alas, not sustainable). If consumption can hold in this 3% range, the annual GDP growth rate would average 2.1% even if the other categories averaged to zero. That is no growth in housing, business spending, government or exports, which is not the most likely case.
Better yet, the income data suggests that 3% consumption rate is quite sustainable. The graph below just adjusted wage growth (basically BLS weekly wage data adjusted for PCE inflation) versus consumption and shows a relatively close relationship over time. (This works better than data that includes nonwage income and bonus income.)
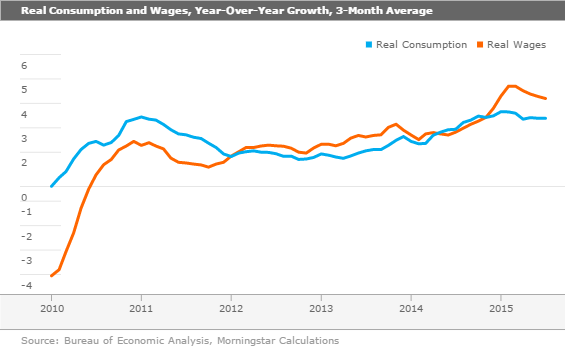
The graph seems to suggest that consumption could accelerate a bit further with consumption growth running around 3% compared with wage growth of about 4%. Still, the wage growth is being inflated by a few good months that will eventually disappear from the calculations. As we noted in our employment section, over all wage growth of 3.0%-3.5% appears to be in the cards (this includes job growth, hourly wage growth and hours worked changes).
It also fascinating to note both ends of the graph above compared with the middle. Between 2012 and 2015 the relationship between wages and spending was nearly perfect, but that relationship breaks down at both ends of the curve. Between 2010 and 2013 consumption outpaced earnings while in 2015 earnings outpaced spending. What gives? Our guess is that consumers continue to spend in a normal fashion when there is either an unusual burst of inflation (the earlier period) or deflation (2015). Consumers correctly perceive that a lot of inflation changes are temporary and therefore don't make big budgetary changes. So consumers kept spending in 2011 despite strong food price inflation, perhaps dipping into savings, and in 2015 all of those gasoline price savings were not spent. Consumer spending seems to be relatively anchored in the short run as consumers have done an excellent job of separating permanent from temporary price increases.
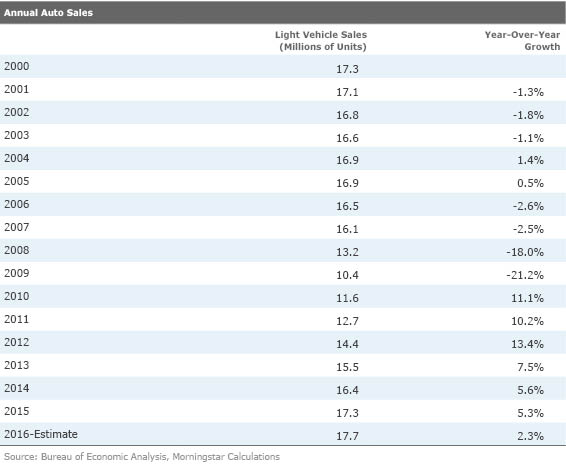
Auto Sales a Sign of Consumer Strength Auto sales are a great real-time indicator of medium-term consumer confidence. Therefore, we were glad to see auto sales on fire in July, with sales of 17.5 million units on a seasonally adjusted rate and a 6.2% year-over-year growth rate. This strong result occurred without some of the smoke and mirrors of selling-day adjustments that have made some months look unusually good. At the seven-month mark, monthly sales are averaging 17 million units in 2015, up 4.6%, better than our full-year forecast for 2015 of just 4.0%.
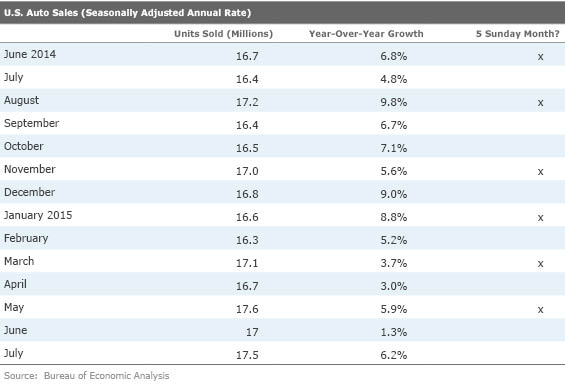
SUVs, pickups, and minivans, which are technically all classified as light trucks, have grown at an over 8% rate year to date while conventional autos eked out a pathetic 1% growth rate. This is fabulous news for U.S. automakers as SUVs, cross-overs, and pickups are highly profitable vehicles that also face less non-U.S. competition. That is partly why recent earnings reports from the auto manufacturers have been stunningly good. It doesn't hurt that consumers are going for higher-end models with lots of add-ons, either. That is driving the average selling price up, along with the unit sales growth. Prices were up more than 3% year over year (to $33,343) and we believe the majority of that increase is a mix/features issue. According to the most CPI report prices were up just 1.2% year over year, so mix and features must have brought the average selling price up by at about 2%. The shift to pickups could be helping the average price calculation. We were shocked to find that the average pickup truck price is now over $45,000.
At the moment it looks like general forecasts for 2015 motor vehicle sales of 16.9 million-17.1 million units will prove to be low with a lot of forecasts creeping up to the 17.3 million-level after the July report. That would make the full-year growth rate just over 5%, very similar to 2014, instead of falling to 3% or less, as we anticipated at the start of the year. This should be great news for the manufacturing sector. It looks like the day of reckoning from a slowing motor vehicle sector will pushed off until 2016.
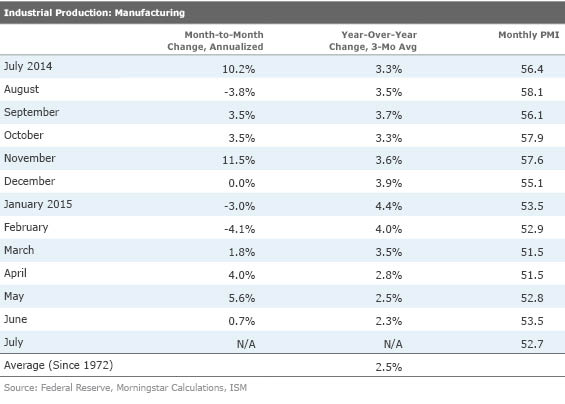
Purchasing Manager Index Down Month to Month, but Fundamentals Remain Sound (by Roland Czerniawski) The ISM Purchasing Manager Index has been falling since October 2014, and the majority of 2015 so far has seen many consecutive monthly declines. After rising to 53.5 in June, the PMI dropped back to 52.7 in July, which is roughly where it was back in May. Nonetheless, we still think that the PMI most likely already bottomed and that some weakness is expected given the heavy disruptions that were brought by low oil prices in oil-related industries. The fundamental drivers of the index and its most important components continue to show improvements. The PMI is composed of five categories: new orders, production, employment, supplier deliveries, and inventories. We pay the most attention to the most useful and forward-looking components: the new orders and production numbers, which have been steadily recovering for a number of months. Employment was an important PMI category that was down in July, but again, it doesn't seem like a reason to panic as it has improved during three out of the past four months. Also, Friday's jobs report seemed to raise no concerns about the durable goods employment. In fact, it showed quite the contrary.
Some of the comments from purchasing managers in various industries seemed to strongly suggest that low oil prices continue to a have negative impact on business in oil and gas, and chemical industries. This issue is most likely to continue pressing on the sector for a little while. Another headwind on the nondurable side of manufacturing is the avian flu, which has been a killer to poultry industry exports. This issue will probably slowly begin to disappear from the monthly numbers as it takes anywhere from two to six months to raise a chicken and restore a healthy supply. Despite those headwinds the distribution of growth in manufacturing remains balanced. Overall, out of 18 manufacturing industries, 11 reported growth, which is the exact number that was reported last month.
Trade Data Settles Down a Bit After very problematic trade data in the first quarter, the recent data has stabilized albeit at relatively pathetic levels. Again we generally focus on year-over-year averaged adjusted for inflation. The month-to-month headline numbers are generally worthless to us. We also generally toss the petroleum data, which does indeed help trade and the GDP calculation. but confuses the overall trend in business activity.
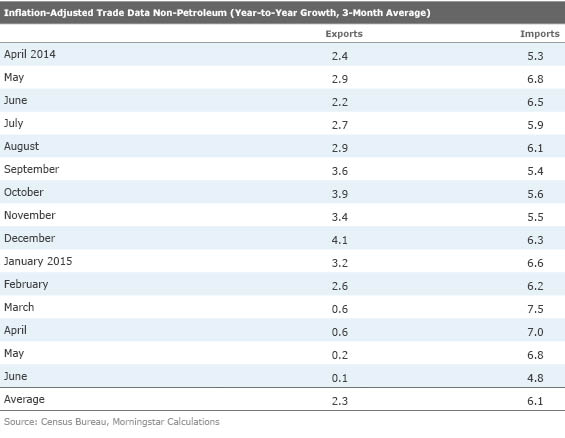
In general, both import and export growth has slowed and remains well below 12-month averages. Some of that is related to the fact that the biggest months of strong growth in both imports and exports (mainly March) dropped out of the averages. Recall that March was a huge month for trade due to the settlement of West Coast port issues. We suspect that there will be little if any export growth in the months ahead while import growth is likely to stabilize in the 5% range. The import number is likely to be a little lower than trend as a surprising amount of the strong import- related activity over the past several years has been energy-related equipment, which is now hitting the proverbial wall.
Weak Commodities and Slow World Growth the Crux of the Export Issue, not the Dollar A lot of commentators have been a bit lazy and pinned all the export weakness on a strong dollar. With the possible exception of autos, that doesn't seem to be the best explanation of the relatively steep drop in export growth. Instead, it is the weak commodity markets around the world that are just killing U.S. exports. Steel, coal, excavating equipment, oil drilling equipment, diamonds, and natural gas are the non-petroleum-related exports that are down big so far this year. Those have little to do with the price of the dollar and everything to do with slow growth in China and falling commodity demand. The one category that is seeing pain too is autos. Year to year, auto exports are down a lot, probably because of slower world growth, but also because of decisions to import certain car models instead of manufacturing them overseas. Auto imports are also up big. That is probably more due to some luxury vehicles coming in and some offshoring of a few models. The relatively large swing in the net auto exports probably deserves some deeper answers than we have now, but is clearly part of the export problem.
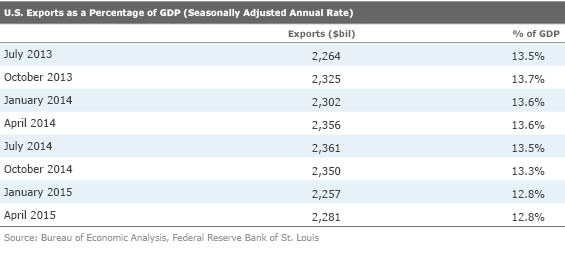
Fortunately, exports aren't a huge piece of the U.S economy, unlike many other countries. Too, some of those exports are airliners, food, and energy products, where there aren't necessarily a lot of alternatives. Still, exports as a percentage of GDP have fallen from close to 14% to just 12.8%, which isn't great news for the U.S. economy.
Retail Sales, Industrial Production, and Job Openings Report Due Next Week By far the most important report for next week will be the retail sales data for July. Retail sales overall are expected to jump 0.7% in July after falling 0.3% in June, continuing their up-and-down monthly cycle that has been confounding analyst estimates. However, the year-over-year data has been a lot more stable, especially when eliminating gasoline. Given the relatively good employment numbers, we continue to expect improvement in both month-to-month and year-over-year retail sales data. We already know that auto sales should look strong, which always starts the report off on the right foot. However, weekly sales data has been nothing to write home about, which makes me feel a little cautious, and that the 0.7% increase might be a little high.
Some of the early warning manufacturing data has been acting a bit better lately, especially anything related to new orders. And until recently (late July) oil prices had been acting all right, helping some manufacturing sectors as rig counts actually moved up in some weeks. Overall industrial production could be up as much as 0.4% by some estimates. Though we note that really tough comparisons probably mean year-over-year manufacturing IP will continue to deteriorate.
Longer workweeks, anecdotal stories, and so-so job growth seem to suggest that job openings continue to be unusually hard to fill, and so far businesses are not caving in and increasing wages. This would seem to suggest that job openings should remain relatively near their all-time high reading of 5.4 million positions.
/cloudfront-us-east-1.images.arcpublishing.com/morningstar/T5MECJUE65CADONYJ7GARN2A3E.jpeg)
/cloudfront-us-east-1.images.arcpublishing.com/morningstar/VUWQI723Q5E43P5QRTRHGLJ7TI.png)
/d10o6nnig0wrdw.cloudfront.net/04-22-2024/t_ffc6e675543a4913a5312be02f5c571a_name_file_960x540_1600_v4_.jpg)