
Mind the Gap 2015
Why investors get less than their funds' total return.
/s3.amazonaws.com/arc-authors/morningstar/fcc1768d-a037-447d-8b7d-b44a20e0fcf2.jpg)
It's time for our annual look at how well investors are making use of mutual funds. I do this by looking at the average investor's returns versus the average fund's returns.
We look at monthly fund flows and monthly returns, then we weight those by asset size to come up with an estimate of returns for the average investor. We then compare those figures with the average fund return on a category and asset-class basis. The gap between those returns tells us how well investors timed their investments. The average investor return is really the bottom line, though. Ideally, you want no gap in returns and a high average investor return.
Recently I've seen the suggestion that the gap is a cost unique to mutual funds. But the gap is applicable to investor behavior in all realms. Whether trading stocks, exchange-traded funds, mutual funds, or something else, investors collectively tend to buy and sell at the wrong times. In fact, a study of equity investors found a gap in returns quite similar to the ones we see on the fund side. Mutual fund flow data just makes it easier to examine mutual funds than most other securities types.
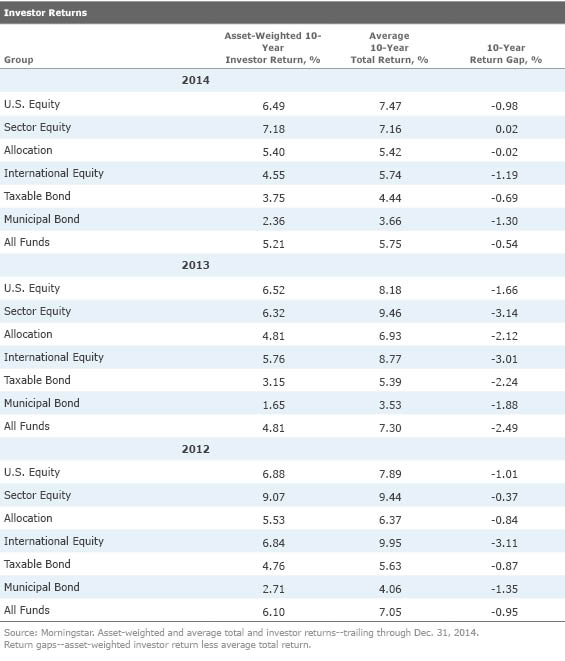
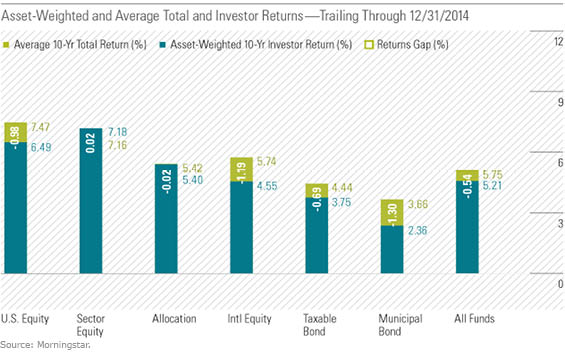
Surprise! The Investor-Returns Gap Shrinks The figures through 2014 are intriguing. Not only did the gap shrink, but the typical investor's return also rose. Overall, the average investor enjoyed a 10-year return of 5.21% compared with a 5.75% return for the average fund, giving us a 54-basis-points returns gap. That compares with a 4.8% return for the typical investor versus a 7.3% return for the average fund through the end of 2013. So, the gap shrank and the average investor return rose. Not bad.
The biggest change came in the balanced-allocation group, where the gap shrank to 2 basis points from 212 basis points. U.S. equities also saw the gap shrink to 98 basis points from 166 basis points. Taxable bonds’ gap shrank to 69 basis points from 222 basis points.
You can see some of the changes in the shorter-term figures. Most asset groups had a positive gap for the trailing three years and an only slightly negative gap for the trailing five years. For example, U.S. equity investors enjoyed a 19.31% annualized return compared with a 18.73% average fund return for the past three years, producing a positive gap of 58 basis points. For the past five years, they enjoyed a 13.89% gap versus a 14.23% average return, producing a modest negative-34-basis-points gap. Why the improvement? Virtually everything except commodities has risen dramatically the past three and five years. This meant that investors could hardly go wrong. Investors were less likely to sell a fund because of poor performance, and, if they did, they likely jumped into a new fund that generally performed well.
The long run of the equity bull market is much easier on investor returns than wrenching pivot years when big gains turn to big losses or vice versa, prompting many investors to sell low or buy high. Thus, bear markets and the dramatic snapbacks that often follow are the worst environment for fund investors. Conversely, a long-running move in one direction produces a positive reinforcement cycle. The 10-year figures now have the pivot years from the 2000–02 bear market out of the system, and the three- and five-year figures are further from the more recent bear market.
The biggest disappointment in the data is for muni-bond funds. There, the average investor netted a mere 2.36% compared with 3.66% for the average fund, thus leading to a hefty 130-basis-points gap for the trailing 10 years. That’s rather dismal considering that muni bonds are a fairly low-risk/low-return asset class that should not lead investors to have big emotional swings. Yet we’ve had two muni scares in recent years: Meredith Whitney proclaiming a disaster that never happened and Puerto Rico and Detroit bankruptcies that were a problem for some but not most muni funds. The upshot was that many muni-fund investors have sold just before a strong rally twice in the past five years.
The Bigger Picture Because time periods have such a big impact on investor returns, I think the best gauge is an average of the gaps from the past calendar-ending five-year periods. That figure is 132 basis points, indicating that investors lag their funds' performance by about that amount, on average, over the long term.
Drilling Down to Morningstar Categories One type of fund stands out as a great match of investor and fund: target-date funds. Across the board, target-date funds have positive return gaps, meaning that investors are making the most out of those funds. The fact that the funds are overwhelmingly held in 401(k)s is the most important factor. Most target-date investors simply select the target-date fund that most closely approximates their retirement date, set their monthly contribution, and then rest easy. When you see funds with the worst return gaps, they are usually highly volatile ones that inspire attempts at market-timing. The evidence shows we do far better when we ignore the headlines and stick to our plans.
That brings me to some of the biggest return gaps: regional stock funds. The four worst are India, diversified Pacific/Asia, Europe, and Japan. These are all fine places to invest, but they inspire people to make bold macroeconomic calls that tend to go poorly. It’s worth remembering that the link between economic growth and markets is surprisingly tenuous. Also, buying after good economic news will often lead you to overpriced securities just as buying after a good earnings report will.
A Bright Line on Risk What happens if you separate funds based on Morningstar Risk? It turns out the impact is dramatic. The lowest-risk quartile has a 6.56% 10-year annualized return versus a 5.3% average return, making for a positive return gap of 126 basis points. The second-lowest-risk quartile dipped to a still respectable 5.88% return and a gap of 4 basis points. The third-lowest-risk quartile had a 5.63% average investor return, making for a 32-basis-points gap. Finally, the highest-risk quartile of funds had an average investor return of 4.53%--that's more than 200 basis points worse than the lowest-risk quartile--and it had a gap of 132 basis points.
The Impact of Fees I spliced investor returns by expense-ratio quartile and found some interesting results. Not only did investing in the cheapest quartile deliver better investor returns, but it also led to a smaller gap. So that means investors in cheap funds chose higher-returning funds and used them better than those in higher-cost funds.
For example, the 10-year U.S. equity return for the average investor was 6.92%, with a gap of 119 basis points. However, investors in the priciest quartile had a meager 3.71% return on average and a huge gap of 299 basis points.
Overall, the average investor return across all funds was 5.61% for the cheapest quintile and 3.28% for the priciest. The gap was 80 basis points for the cheapest quintile and 179 basis points for the priciest.
Take-Aways The big improvement in investor returns is a happy accident of the markets, but the details provide a number of valuable lessons that we can apply to improve our own results.
- Focus on your plan, not the news. Market-timing is very difficult to do well, so stick to your plan and keep investing. Markets, after all, generally go up.
- Look for lower-risk funds. Funds with High Morningstar Risk ratings lead to lower returns and a wider gap. After a long-running bull market, this is probably more important than ever. Lower-risk funds may appear rather unappealing, but you may well hold on to these funds through the next downturn and sell the high-risk funds at the worst time.
- Find the right funds for you. If you have made a lot of fund trades over the years, maybe you need to dial down the volatility. Target-date funds are tremendously diversified and therefore kind of dull. But that's a good thing. Dullness keeps emotions out of the equation, and it is emotional investing that wrecks a good plan. Target-date funds and balanced funds can help you steadily reach your goals.
- Look for funds and fund companies that close funds before they get too big. You can do this by finding funds that have closed in the past but have reopened. In addition, some funds will name a closing target well in advance so you can have some confidence that the fund won't suffer asset bloat going in. Some firms such as Primecap are particularly dependable at closing funds. Others such as Dodge & Cox, Vanguard, and T. Rowe Price have closed funds, though not at particularly low asset levels.
- Low-cost funds should be a key part of your strategy. They have higher returns and tend to be even less risky because they have a lower hurdle to overcome.
/cloudfront-us-east-1.images.arcpublishing.com/morningstar/ZKOY2ZAHLJVJJMCLXHIVFME56M.jpg)
/cloudfront-us-east-1.images.arcpublishing.com/morningstar/IGTBIPRO7NEEVJCDNBPNUYEKEY.png)
/cloudfront-us-east-1.images.arcpublishing.com/morningstar/HDPMMDGUA5CUHI254MRUHYEFWU.png)
:quality(80)/s3.amazonaws.com/arc-authors/morningstar/fcc1768d-a037-447d-8b7d-b44a20e0fcf2.jpg)