
Steady Recovery but No Boom for Housing
There was a surge in permits, but under closer scrutiny the data shows that multifamily activity drove the majority of growth in June.

It was another week of big ups and downs for world markets. Generally, European and U.S. equities both did well for the week, notching 2%-3% gains. A lot of that strength was due to news of a settlement of the Greek situation. Our view has always been that Greece is not a big deal to the world economy either way, and that there was no real reason for the sell-off of the past several weeks. So now that things have settled down the markets are bouncing back. China's second-quarter GDP growth rate of 7% and the first weekly stock market gain in the past four weeks helped world equity markets, too. In general, second-quarter earnings news from the banks and a couple of high-profile tech companies also gave a little extra boost to the markets.
Economic news for the week was a mixed bag. Retail sales were very disappointing, indicating that consumers are still not in a buying mood. Retail sales were down 0.3% month to month, led by an already known artificial decrease in auto sales. There were a lot of other poorly performing categories and very few big gainers. Year-over-year retail sales growth also trended back down to more normal levels, but not enough to sound a panic alarm. Also keep in mind that the previous month of retail sales growth was stunningly strong. On the other hand, housing news was very strong in June based on the starts and permits data released on Friday, which should provide a big boost to the second half as we have been hoping for some time. Industrial production indicated that the manufacturing sector has at least stopped getting worse, but isn't likely to be a big help for the economy in 2015.
The markets really held up well despite all the talk from the Fed, which was perhaps the biggest surprise this week. In speeches and testimony on Capitol Hill, the Fed said that barring a big economic surprise, its intent is to raise rates this year. (With Greece and China stabilized for now, the Fed now has two fewer things to worry about.) Poor retail sales probably raised hopes that the Fed wouldn't raise rates this year, but Friday's inflation report and strong house data seemingly dashed those hopes. The U.S. 10-Year bond had a quick shot up earlier this year in anticipation of higher rates, but has been surprisingly stable lately as those fears become reality. This week, the 10-year rate was down very modestly from 2.39% to 2.35%.
Commodities were the big loser for the week, down more than 5% on a big slump in oil prices. Oil prices started trending down last week on rumors of a deal with Iran and the potential lifting of sanctions, then went into full-blown panic mode this week when an actual deal was announced. Lower oil prices also kept a lid on emerging-market stocks and maybe interest rates as well. Despite a better stock market performance from China this week, emerging-market stocks were down modestly for the week.
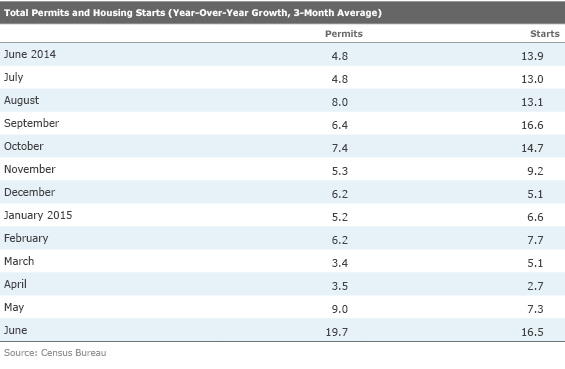
Starts and Permits Surge Driven by Multifamily Construction (by Roland Czerniawski) Housing data revelations dominated headlines on Friday, after starts and permits growth exceeded most expectations by rising back to their 2007 levels. After dissecting the data, however, it became obvious that multifamily activity drove the majority of the growth in June. Multifamily permits rose 15.3% in June, after rising 20% in both April and May. Compared with a year ago, multifamily permits are now 70% higher. Multifamily starts surged, too. The New York City area is almost exclusively the reason behind the rapid increase in multifamily construction, as developers were racing to beat the deadline for multifamily construction tax incentives that were set to expire in July. This has distorted the headline numbers for both starts and permits.
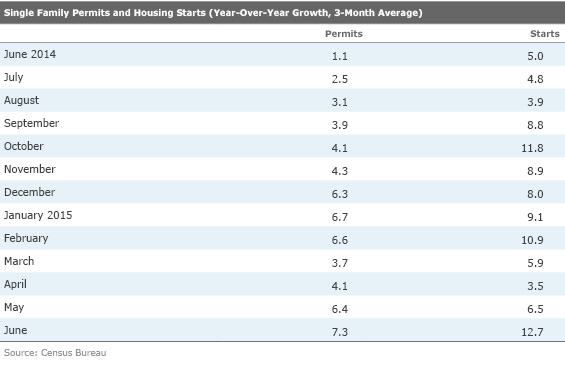
The volatility of multifamily starts and permits is nothing new, as those numbers tend to swing widely month to month. In order to understand the underlying trend of the starts and permits data, it might be more useful to follow the single-family categories. On that front, the increases weren't nearly as impressive, but they weren't tragic, either. On a year-over-year three-month moving-average basis, both single-family starts and permits are doing fine, showing a meaningful pickup in the pace of growth. Year-over-year, averaged for three months, starts have now accelerated to a double-digit growth rate, despite the fact that monthly June growth was actually negative. This just shows that starts and permits are doing much better than a year ago, and the most recent multifamily volatility, which will probably revert to trend in the months ahead, does not change the big picture.
Retail Sales Softer Than Expected Just about any way you want to cut it, retail sales for June were soft. The headline, month-to-month number unexpectedly declined 0.3% for June, the first drop in four months. Even excluding autos, sales still fell by 0.1%. Excluding gasoline and autos, our preferred metric, overall sales fell 0.2%. Everyone knew the auto sales portion of the report would look soft because earlier reported auto sales for June were down. No worries on the auto decline--that was due to a calendar day methodology flaw and not a true decline. Still, softness in this many sales categories and the overall outright decline were disappointing. Though, month-to-month numbers are volatile and subject to change. Also, May was a remarkably strong month, setting an unusually high bar. The year-over-year data still showed relatively good growth, but still not nearly as good as it had been. The graph below shows the month-to-month data for what it is--nearly worthless--because of all the volatility. The year-over-year data paints a truer but not perfect picture. Note that nonexistent inflation over the past few months makes the inflation-adjusted and the nominal retail sales growth rates identical for several months in a row.
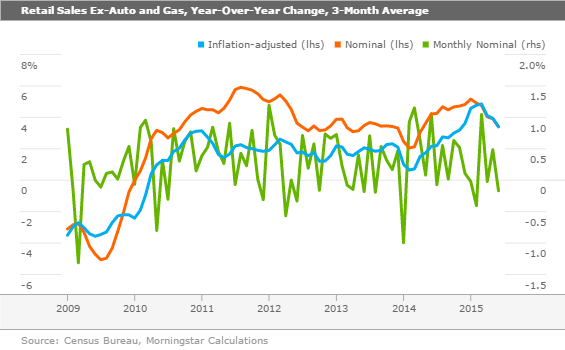
Explaining the ups and downs of the year-over-year retail sales report is a little tricky. For a four-year stretch, from 2010 to 2013, retail sales, adjusted for inflation, were stuck at the 2% level. Then the rate dropped sharply in the first quarter of 2014 to about 1% because of the horrific weather, then got an artificial bounce to around 3% as buyers raced to catch up for lost time. Then a combination of lower inflation and sharply improved employment data, along with exceptionally easy comparisons to the rough winter of 2014, allowed growth to peak at around 5% in March. Now economists are plotting second-quarter retail sales against those big weather-related rebound months of mid-2014, forcing the growth rate down to 3.4%, which is still above trend. As year-over-year inflation rebounds in the back half of 2015 and comparisons remain difficult, year-over-year retail sales growth is likely to drop into the more normal 2.0%-2.5% range. Unfortunately, that also means none of the accelerating, escape- velocity 4% (or even 3%) GDP growth everyone keeps waiting for. High growth rates across a broad set of economic metrics last fall and early winter now look to be a one-time thing and not the start of sustained long-term growth.
Sector Data Nothing Special, Either Probably most surprising was the breadth of sectors that showed an outright month-to-month decline for June. Only five of the 19 categories in the main report (which includes a few overlapping subcategories) showed increases. One was unchanged, and 13 had declined. Again, some of breadth of the decline is due to the notorious monthly volatility and probably some faulty seasonal factors to boot. Also, May was unusually good, setting a very high bar. With employment data still basically intact, it's hard to imagine the numbers are quite as bad as the headline and sector data suggest.
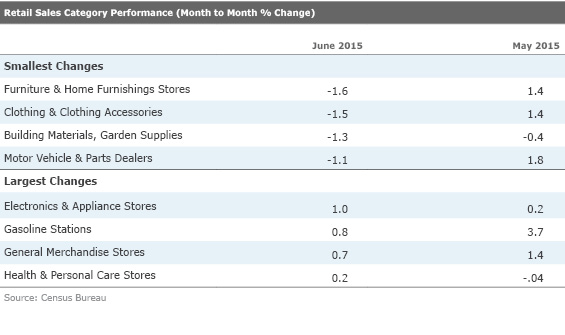
The table above shows a number of very big losers, with the biggest losers far outpacing the biggest gainer in magnitude. Perhaps slightly more worrisome were a couple of items that did not make the extremes list. First, restaurant sales were down 0.2%, which followed very anemic 0.2% growth rate in May. Over the past year restaurant sales were up a still impressive 7.7% (which equates to a monthly rate of about 0.6%). We always hate to see this category soften because I think it is one of the best short-term indicators of consumer sentiment. It's also been an important driver of the overall retail sales report and the very healthy growth rates reported at the end of last year.
The other worrisome category was non-store retailers (think online retailers like
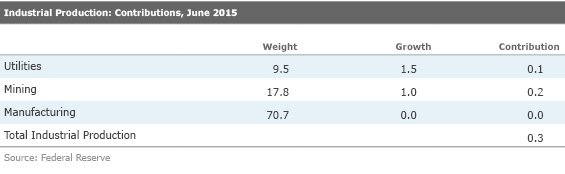
Industrial Production Looking a Little Better Manufacturing had a great year in 2014 through a combination of energy-related production equipment, a good year for autos, and export demand. Those engines of growth have all slowed and 2015 has been a rough year for manufacturers. And that has slowed the growth in manufacturing employment to almost a complete halt. Finally, the month-to-month industrial production numbers are showing some improvement and the year-over-year deceleration is slowing. Industrial production, including utilities and mining, has been down or flat for four of the past six months, often led by problems in the oil patch. Still, even conventional manufacturing has had a rough go of it in 2015. It now appears that manufacturing has stabilized and even mining is seeing a small rebound, as shown below.
Looking at the manufacturing-only data, the sector has at least stabilized on a month-to- month basis after a very dismal winter. Although the overall manufacturing number was unchanged on a month-to-month basis, it would have been up 0.3% were it not for a 3.7% decline in auto-related production. Given that auto sales are on a decent overall trajectory, the auto production numbers should not be detractors going forward. Auto sales and production are now in relatively good alignment.
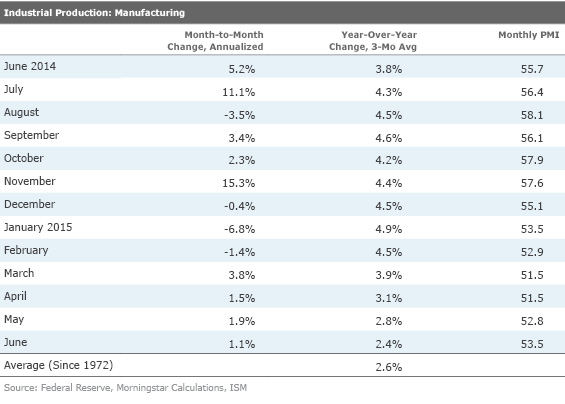
The year-over-year, averaged data is still trying to find a bottom. It looks as though the year-over-year data should bottom in the 1%-2% range later this year, though one can't rule out the possibility that year-over-year data could decline for a month or two. Given that manufacturing accounts for about 10% of all employment, this softness is not a good thing.
The sector data wasn't terribly enlightening, with about half the categories up and half down on a month-to-month basis. Computers, furniture, and chemicals all finally looked a lot better after a few terrible months, while autos and wood products registered large declines.
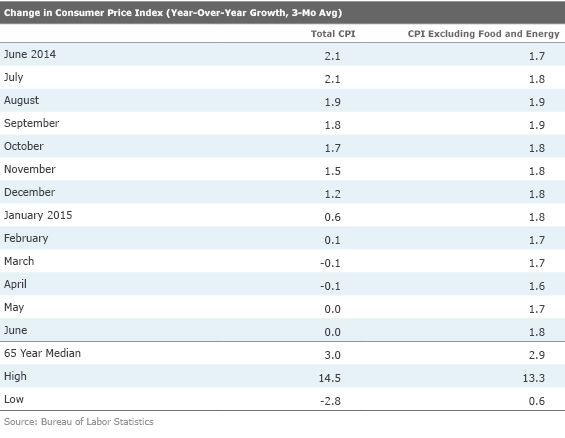
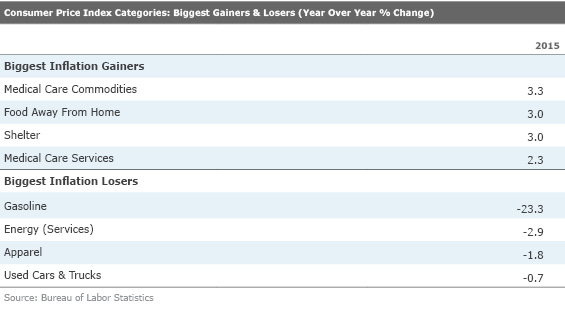
Year-Over-Year Inflation Back in Positive Territory June consumer prices were up 0.3% month to month and a positive 0.1% on a year-over-year basis (1.8% excluding food and energy). Year-over-year inflation has generally been flat or down since December, primarily because of lower gasoline. Prices excluding food and energy are up 1.8% and have been incredibly stable at that rate. So as gasoline prices normalize, year-over-year inflation will begin approaching 1.8%, which is just a little shy of the 2% the Fed is aiming for. Overall, the inflation rate is just about where we would want it: high enough to give the Fed a little wiggle room, but not so high as to ruin consumer spending. With energy and gasoline prices down big this week, I doubt that high gasoline prices are going to spoil the party, which was a possibility if prices hadn't begun to fall this week.
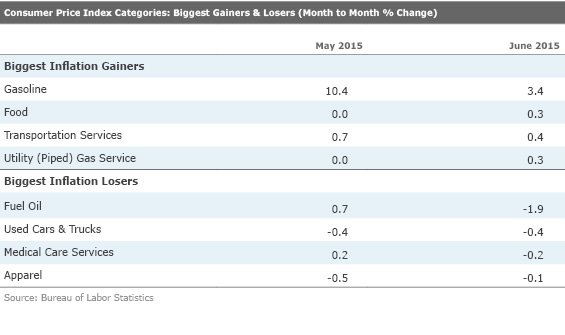
In terms of individual categories, gasoline led the pack with a 3.4% monthly increase, after increasing 10.4% in May. With that being said, gasoline is down 28% from where it was a year ago, so while the gasoline "tax" break continues to diminish, it still provides a net benefit to consumers compared with last year. What might be more troubling is the increase in food prices that grew 0.3% in June, and those are now 1.8% higher compared with June 2014. The outbreak of avian flu, which has been disrupting the egg and poultry market, has been the cause of some of those food price increases. The effects of it are now visible in the CPI, but the hefty price increases, especially for eggs, are most likely to continue in the months ahead. The rapid rise of health-care costs, both in the drug and the hospital services space, has been another troubling trend. Those costs began to cool down in June as drugs stayed flat after rising 0.4% in May and medical care services were down 0.2% after increasing 0.2% a month prior.
Builder Sentiment Still High Overall builder sentiment for July remained at a recovery high of 60 for the second month in a row (June was revised up from 59 to 60). Particularly notable is how much higher the sentiment is now versus a year ago for the same month. The sentiment data seems to be aligned with the starts and permits, as building activity seems to have generally accelerated.
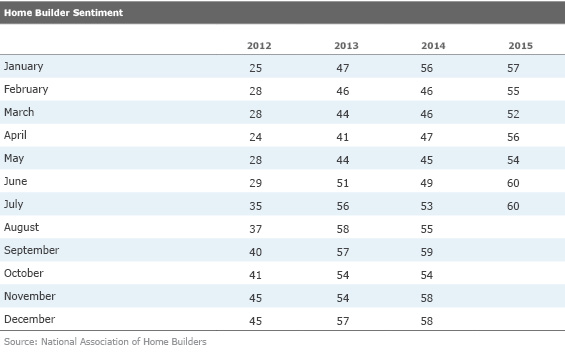
All four geographic regions showed improvement with the best levels being recorded in the two largest regions, the South and the West. In the three-part report, current conditions and future prospects showed nice increases while current traffic was down modestly. That's always a bit troubling because people need to see a home or at least a model home before they can make a purchase. However, we always wonder if the traffic numbers are looking softer because markets are weak, or if buyers are doing more online home shopping.
Housing Reports Will Dominate Next Week's Economic News After this week's flood of data, next week's data flow drops to a mere trickle. Most of the news that is coming out relates to the housing industry, which remains the linchpin of a stronger second-half recovery in the United States. Housing has been a small contributor to GDP over the past year. We suspect that when the second-quarter GDP figures are released housing will be a more significant contributor. In the back half of the year, it could be an even bigger contributor. Our optimism is based on better consumer incomes and more favorable demographics as well as strengthening builder sentiment. Next week we will see results for both existing- and new home sales. Based on high but relatively stable pending home sales, we suspect that existing-home sales will be very close to last month's existing sales rate of 5.35 million. However, I always caution that this series has been on a month-to-month roller-coaster, which is likely a combination of statistical and weather issues. However, our more reliable year-over-year, averaged data shows steady improvement since fall 2014, with the year-over-year growth rate near 9%. This sales increase should help drive several consumer categories higher in the months ahead. If our forecast for June is anywhere near close, commissions on existing-home sales should add 0.2% or more to the GDP calculation all by itself, before adding in remodels and new homebuilding.
New home sales have been on a run in 2015. Four of the first five months of 2015 showed sales of over 500,000 units. Between 2008 and 2014, sales didn't get above that level for even one month. Except for a surprise dip in March, new home sales have been relatively stable and stronger than housing starts and even housing permits. We think it may be hard to sustain the unusually strong 546,000 units sold in May for the June report, but given seasonal factors I suspect that the June new home sales level will get very close to the May levels. We will also be closely watching the report to see how many homes were purchased that had not even been started. This category (versus partially started homes, and completely finished homes) has been growing in importance for the past several reports. We would also like to see higher home inventories, which tend to generate more sales volumes.
Markit will publish world purchasing manager "flash" data for March later in the week. This is usually a market-moving report because manufacturing is an important part of the European and Chinese economies. Both Europe and China have shown a higher index value for two consecutive months. Economists are optimistic that with various stimulus measures, that run is likely to increase to three. With China's GDP slightly higher than expected, hopes are high that China's index moves back over 50 from the May reading of 49.6, which is still modestly contractionary (a reading of 50 separates periods of growth from periods of contraction.) However, it remains to be seen if the theatrics of the Chinese stock markets have any impact on these readings.
/cloudfront-us-east-1.images.arcpublishing.com/morningstar/F2S5UYTO5JG4FOO3S7LPAAIGO4.jpg)
/cloudfront-us-east-1.images.arcpublishing.com/morningstar/7TFN7NDQ5ZHI3PCISRCSC75K5U.png)
/cloudfront-us-east-1.images.arcpublishing.com/morningstar/QFQHXAHS7NCLFPIIBXZZZWXMXA.jpg)