
China and Greece Push Everything Else Off the Radar
What matters more, the Chinese stock market decline or the potential for Greece's exit from the eurozone?

It was a brutal week for market volatility even though price changes for most equity markets, on a week-over-week basis, were relatively muted. Most equity markets and commodities faltered early in the week on continuing issues in Greece and a very unsettled market in China. Then, as a deal on Greece seemed within reach and the Chinese finally stabilized their markets (after declines from late spring peaks approaching 30%), markets around the world rallied sharply the last two days of the week.
This week, Europe was the big gainer with equity markets generally up more than 1%. U.S. equity markets were little changed for the week, and emerging markets took a bad hit, falling more than 3%. Supply issues in the oil and gas industry continued to mount early in the week along with talks of Iran re-entering the oil market. Overall, commodities were down almost 3%, nearly as bad as the performance of emerging-markets stocks. On the week, bond interest rates were generally higher, with the U.S. 10-Year Treasury moving from 2.39% to 2.41%, with some big rebounds in rates at the end of the week.
Almost all of the focus this week was on the Chinese stock markets and the Greek situation. As those dilemmas worsened at the beginning of the week, markets went into free-falls, then reversed themselves midweek as those two predicaments seemed to at least settle down.
The biggest debate among economists this week was, what mattered more, the Chinese stock market decline or Greece's potential exit from the eurozone? With a Chinese economy at $10.7 trillion and Greece at $0.2 trillion, it didn't seem like much of a fight to me. That said, several of my colleagues correctly noted that Greece had some potential for wrecking the EU system, which is a very large, $13.4 trillion economy. I continue to strongly hold my view that Greece itself and the solutions to its problems are meaningless to the world economy. It has been laid bare (and nobody can put this genie back in the bottle) that Europe continues to have a very hard time acting as a single and decisive economic unit that can deal with tough times and hard issues.
China's situation remains much more worrisome. Yes, the near-30% collapse from the high-water mark this spring in the Shanghai index can be damaging to a relatively leveraged system, but the market is still up over 70% from a year ago. Like the collapse of the U.S. Nasdaq market in 2000, we doubt the fall will cause a collapse of the Chinese economy. A pause, maybe; a collapse, not likely.
What's got me worried is that the government continues to believe it can manipulate the stock market at will. They egged up the market with buy-the-market propaganda, then lost control on the way up as prices got just plain silly. Then its attempts at a soft landing ended badly, forcing it into even more manipulation. And when conventional credit easing and margin relaxation rules didn't work, it barred not only short sellers, but also almost all large institutional sellers. It also threatened short sellers with police action and rolled out even more propaganda and market-encouraging editorials, slogans, and chants. For now, the government has successfully stopped the free-fall. I am convinced the government thinks it is doing the right thing by supporting markets and that its heart is in the right place. However, even the Chinese government cannot fight the laws of gravity over the long term, and short-term manipulation can only make the inevitable crash to earth worse than it otherwise might have been.
News on the Greek and Chinese fronts pushed out of the headlines the normally market-moving Federal Reserve minutes, a Fed Chairwoman Janet Yellen speech, and a major IMF world growth forecast reduction. The Fed minutes didn't add a whole lot to the debate over when it would raise rates, even though a rate raise or two this year seemed to be the path of least resistance. However, the Fed noted that Greece might at least have some influence on its decision if it made all of Europe slow down. And as always, the Fed promised to remain data dependent. To us, that is just another of saying watch the economy, not the Fed, which has been our mantra for some time.
The IMF growth rate reduction would normally have been more problematic, but this time it was a bit behind the curve in reducing its world growth rate forecast yet again, from 3.5% to 3.3%. As we mentioned earlier, other news forced this story out of the headlines, too.
U.S. economic news was limited this week, and earnings news was basically nonexistent. The raw number of job openings set a new record, even if the rate of growth in new openings appears to be slowing a bit. The federal budget deficit, with the help of $30 billion of profits on spectrum auctions in fiscal year 2015, now has a 50/50 shot of coming in below $400 billion (about 2.2% of GDP). News on May imports and exports was about as expected and economists heaved a collective sigh of relief as net exports in the second quarter are now likely to have little impact on second-quarter GDP growth. That would be welcome news since net exports subtracted close to 2% off of the first-quarter GDP calculation.
Trade Balance Stabilizing The trade balance was the single largest factor in the economy's sloppy first-quarter performance. Trade took almost 2 full percentage points off of the GDP calculation. Without the negative trade performance, the economy would have grown 1.7% instead of shrinking 0.2%.
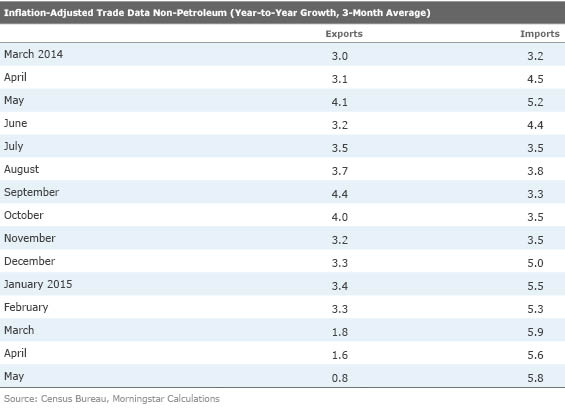
Soaring imports in March, which were related to the settlement of the West Coast labor issue, were a key factor in the large swing in the trade data during the first quarter. That swing largely reversed itself in April, and the just released May data shows that most of that April improvement held in May. The trade deficit, which had swung as high as $50 billion in March, moved to $40.7 billion in April and stabilized in May at $41.9 billion.
If the trends in April and May hold for June, trade should have a neutral effect on the second-quarter GDP calculation. That is, if everything outside of trade remained the same as the first quarter, second-quarter GDP would be 1.7%. Wild quarterly swings in trade data are not unusual even without a port strike. However, over the course of a full year, net exports have not had much effect on the GDP calculation. The contribution from trade has run from a negative 0.2% to a positive 0.2% over the past three years. We have made a very similar argument concerning swings in inventory.
That said, imports have shown relatively stable and high growth in the 5%-6% range on a year-over-year, three-month averaged basis, while exports have shown relative deterioration so far in 2015. On a year-over-year basis, exports are struggling to grow even 1%. While a strong dollar gets most of the blame for the deterioration, the real answer isn't quite as easy. Weak commodity markets have hurt a lot of machinery accounts and the agricultural sector. In addition, better weather conditions around the world have slowed the growth of U.S. farm exports, regardless of the dollar. Regional issues have hurt, also, as exports to South America have taken a real drubbing as conditions there continue to soften. So to those who say a stabilizing dollar will help the trade deficit in the back half of the year, please take a closer look at why exports have slowed.
Plus, while export growth has slowed, it isn't collapsing. Nor even in the best of times have exports grown much more than 3% or 4%. Right now, exports are running 12%-13% of U.S. GDP. However, the math still suggests that if exports don't grow at all versus growing as much as 4% represents about a 0.5% swing in GDP growth. That isn't anything to sneeze at in the world of 2.0%-2.5% U.S. GDP growth.
Autos, which probably are more affected by a strong dollar than many other categories, have seen some export weakness and import strength.
Job Openings Strong for Now, but Fading The job openings report continued to show growth in May, setting yet another record for job openings at 5.36 million, up over 16% from a year ago and 0.5% (6% annualized) from April. Although records go back only as far as 2000, this is the highest reading in the entire data set.
Most economists have viewed this as a highly positive and leading indicator of future employment data. Most job openings needed to be posted before they can be filled, and the hiring process can take somewhere between days and months, depending on the complexity of the job and the tightness of the labor market.
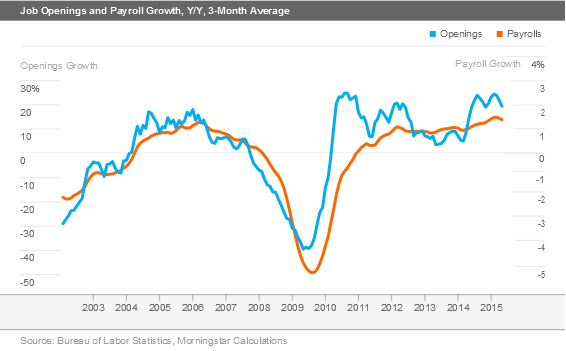
We have pointed to the job openings data in several reports as an indicator that labor markets are tightening. Indeed, the indicator did a great job of forecasting the surge in hiring in late 2014 that almost no other indicator did. In the late spring of 2014, openings surged from the single-digit-growth rates they had maintained from 2012 to 2014 to double-digit-growth rates.
The graph below reinforces the general concept that job openings are a leading indicator, although they can be a bit jumpy and overreactive. Right now, the indicator seems to be saying that job growth may be plateauing as year-over-year averaged growth in openings is showing early signs of peaking. Year-over-year growth is still elevated at 19% but that is down from a high of 24% several months ago.
As we noted above, the month-to-month growth rates in openings have fallen to 0.5%, which is just 6% annualized, suggesting there is more potential for the year-over-year rate to continue falling. Also noted above, the single-point, unaveraged year-over-year growth rate was already down to 16%. Certainly the data is nothing calamitous, but a little worrisome nonetheless. The JOLTS data corroborates last week's employment report for June, which was healthy but not as strong as it had been.
U.S. Budget Deficit on Target to Fall to $380 Billion-$435 Billion From $486 Billion Data released by the Congressional Budget Office showed that the budget deficit, adjusted for a timing difference (a key payment date landed on a weekend) dropped from $367 billion to $313 billion for the first nine months of the year. If the deficit for the last three months of the year were the same as last year, the full-year deficit would come to about $433 billion (2.6% of GDP). If everything goes right and tax collections remain strong and costs remain under good control as they did in the first nine months, there is a shot that the deficit could fall as low as $380 billion (2.2% of GDP).
These numbers are a lot better than the government was thinking and even better than we were thinking just a month ago. The latest "gift" to the deficit numbers was $30 billion from spectrum auctions over the past several months that weren't in our estimates. June trends and spending also remained excellent (with yet another big negative student loan adjustment being the key exception).
June is a big collections month, so for the single month of June there was a budget surplus of $55 billion, well ahead of last year's $35 billion surplus, despite the aforementioned, multibillion-dollar student loan adjustment in June. However, the sale of spectrum more than made up for the student loan adjustment, which is becoming a standard feature of the June budget report. Below is that data for the first nine months of fiscal year 2015
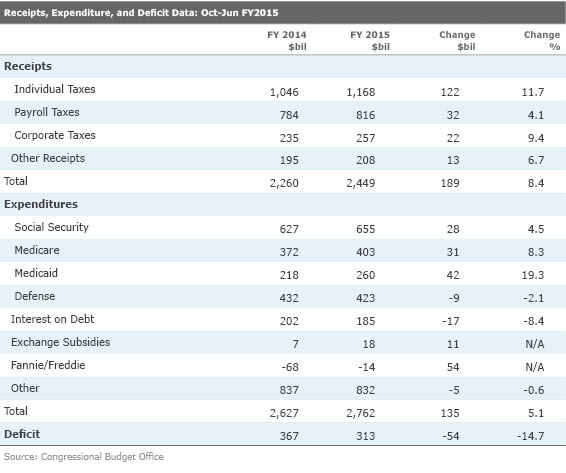
The bottom line is total revenue is up 8.4% for the year while spending is up only 5.1% (6.3% when throwing out the income from the spectrum sales, which was recorded as a reduction in the FCC's budget spending). Tax collections are up a lot more than expected because of the tax on capital gains and bonuses, which are notoriously hard to forecast. Corporate taxes have also done well as corporate profits have been stronger than anticipated. Low inflation, continued low interest rates, and smaller deficits have also kept a lid on interest expenditures.
Almost all of the big spending increases are coming from the major transfer payment/medical-related programs, while there is little real growth in all other expenditures. That is really an amazing statement to make. It's hard to believe the deficit approached 10% just six years ago. Just a year ago, getting the deficit under 3% still seemed tough. Now the United States is closing in on a 2% deficit.
IMF Lowers World Growth Outlook Yet Again At least twice a year the IMF re-does its entire world growth outlook. This week's revisions to the prior forecast, produced in January, which was in turn also lower than the forecast produced in October 2014. That October forecast predicted world growth of 3.8%, which was reduced to 3.5% in January and now 3.3% in the July update. That is lower than the 3.4% actual world growth rate for 2014. And much like the United States, it's stuck in a rut that it can't dig itself out of, with world growth equaling 3.4% for each year of 2012 through 2014. (U.S growth has been between 2.1% and 2.4% since 2011).
As has become an embarrassing pattern, the outlook for 2016 remains intact at--you guessed it--3.8%, a nice acceleration from 3.4% in 2014 and the best level since 2011. Well, that is what the IMF is hoping for. The litany of positives for world growth prospects is long, including low energy prices, more confidence, better labor markets, and easy monetary conditions, according the IMF. Sadly, that list was relatively similar both last October and last January when the previous forecasts were made. It seems like it hasn't quite adjusted to the reality of weakening world demographics.
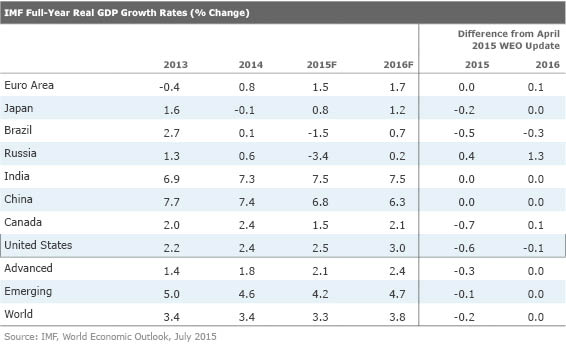
There were some bright spots in the report, besides the high hope for 2016. In a pleasant turn of affairs, the forecast for the large euro area were unchanged from the previous. India's and China's forecasts were also unchanged. The unchanged China data looked just a little odd given all the text in the release noting many issues in China, including its wildly fluctuating equity markets and an ongoing rebalancing of the Chinese economy. If those are the bright spots, much of the blame went to the United States, which has seen its growth forecasts slashed in the two most recent forecasts. The weather, port strike, and energy issues are cited, but its growth forecasts were way too optimistic to begin with. The other low light of the report was Brazil, which is being clipped by commodity price declines, and financial market volatility, all at the same time. Interestingly, Brazil/South America issues also turned up in our analysis of the trade deficit.
Fortunately, the markets largely ignored the IMF downgrades, perhaps because the cuts have become relatively predictable. Headlines out of Greece and China did keep the IMF report out of the spotlight. This is in contrast to other times this report had moved markets substantially in both directions, usually more down than up.
Data Floodgates Open Wide Next Week: Retail Sales, Housing Data, Consumer Price, and Industrial Production Retail sales and housing starts will fight for the most important economic indicator of the week. With consumption making up 70% of GDP and retail sales making up a third of that, this is an indicator that cannot be ignored. However, changing inflation rates and auto sales can seriously mess with the interpretation of this key data point.
Don't let the likely huge drop in retail sales for June panic you. May's retail sales grew a stunning 1.2% on the back of a very favorable calendar alignment for auto sales in May and a huge spike in gasoline sales (this report is not adjusted for inflation). Now in June, we know that auto sales will be down on an unfavorable calendar and a decline in gasoline prices. So that stunning 1.2% growth rate for May is expected to drop to a meager 0.2% growth rate for June. Combining May and June still produces a very healthy 0.7% growth rate for the combined months. As always we will be focusing on year-over-year averaged growth excluding autos and gas, which should stay at about 4%. We will also be closely watching restaurant sales to gauge the real consumer sentiment. The past few months, restaurant sales (and employment growth, too) have been a little softer than we like to see.
Given continued slowness in business spending and a weak manufacturing sector, housing is increasingly important in projecting the trajectory of the economy. Builder sentiment, existing-home sales, and new home sales have generally looked better recently while housing starts have looked terrible and permit growth has been skewed by an expiring tax credit for New Yorkers. This month is do or die for the lagging starts data. We are hoping that starts will move from a weather-depressed 1 million starts in May to a much better 1.1 million units in June. That may not be nearly the stretch that one might expect given May permits were 1.3 million annualized units and sales of new homes not started or permitted have been showing some very healthy growth. On the other hand, permits could fall as much as 20% (1.3 million to 1.1 million) with the expiring New York tax credit.
Largely because of high gasoline prices, the Consumer Price Index surged 0.4% in May. Seasonally adjusted gas prices in June moved up to a more palatable 4% (after gaining 10% in May), which could take 0.3% off of the June inflation rate compared with May's rate. That could bring the June inflation rate down to 0.1%, which is well below not only last month, but also the consensus estimate of 0.3%. Year-over-year inflation should remain close to zero for June, but could accelerate to as much as 2% by year-end due to the waning effect of falling gasoline prices. That is, if the price of most other goods remain on their trend lines.
Manufacturing has had a rough year, even if recent results in a lot of manufacturing data points have shown limited and very boring growth. Already-reported slow growth in manufacturing employment for June will limit manufacturing production growth rates for June. The mining sector is trying desperately to find a bottom and rig counts seemed to have stopped going down. Unfortunately, cool weather is likely to reduce seasonally adjusted electricity usage for June, the third major component of industrial production. Combining all three, the consensus is for a boring 0.1% increase in overall industrial production and a similar decline in the manufacturing-only component.
/d10o6nnig0wrdw.cloudfront.net/04-22-2024/t_ffc6e675543a4913a5312be02f5c571a_name_file_960x540_1600_v4_.jpg)
/cloudfront-us-east-1.images.arcpublishing.com/morningstar/PKH6NPHLCRBR5DT2RWCY2VOCEQ.png)
/cloudfront-us-east-1.images.arcpublishing.com/morningstar/54RIEB5NTVG73FNGCTH6TGQMWU.png)