
A Closer Look at the Total Cost of ETP Ownership
When looking for the lowest-cost exchange-traded product, it's important to take a holistic approach and mind the bid-ask spread.

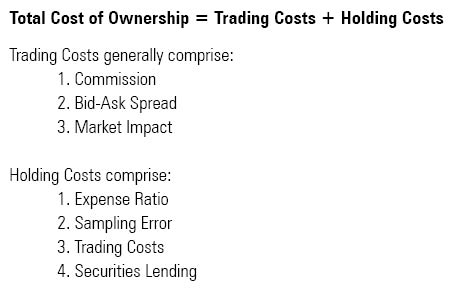
Finding the lowest-cost exchange-traded product, or ETP, entails more than simply seeking out the one with the lowest expense ratio. The expense ratio is just one component of the total cost of ownership, which can be broken down into trading costs and holding costs.
Investors have some degree of control over trading costs, which are made up of things such as the brokerage commission, the bid-ask spread, and the price impact resulting from large trades. On the other hand, the ETP's sponsor and the portfolio manager are largely responsible for the holding costs. In aggregate, holding costs measure an ETP's benchmark-relative performance. The expense ratio tends to be the largest, most explicit, and most stable component of the total cost of holding an ETP.
However, there are other factors to consider, including implementation shortfall on the part of the portfolio manager and any potential offset from securities lending. Holding cost is easy to measure, as it entails comparing an ETP's performance with the performance of its benchmark index. In contrast, trading costs can be more difficult to measure.
Trading costs can become a more important consideration for short-term traders who will pay the entire cost of buying and selling an ETP but shell out just a fraction of the fund's annual expense ratio. Trading costs are also of particular importance to investors moving a large percentage of a fund's average daily trading volume. The more liquidity that an investor demands (as measured in terms of frequency or trade size), the more significant trading costs are as a component of the total cost of ownership.
One of the biggest components of trading costs is the bid-ask spread. The bid-ask spread is the difference between the highest price an investor is willing to pay for an ETP's shares (the bid) and the lowest price at which a seller is willing to part with them (the ask). This amount is pocketed by a market maker as compensation for matching buyers and sellers.
In assessing liquidity, it is important to assess both the liquidity of the ETP itself (using measures like the bid-offer spread and trading volume) as well as the liquidity of its underlying assets (blue-chip stocks are more liquid than bank loans, for example). Taken together, these factors help to explain the ETP's bid-ask spread.
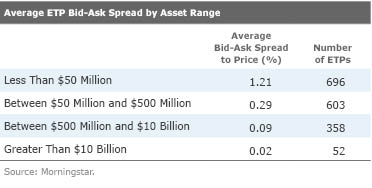
Morningstar calculates an equal-weighted average of each of the unique best bid-ask spreads quoted throughout the trading day. Analyzing the data, a few clear trends emerge. First, in general, the more assets an ETP has the more liquid it will be. The table below shows the average bid-ask spread as a percentage of an ETP's price for 1,709 U.S.-listed ETPs. I calculated the average over the 30 trading days through June 19, 2015. During this period, the average bid-ask spread among the 41 ETPs with more than $10 billion in assets was just 2 basis points. When estimating the total cost of an ETP, the cost represented by the bid-ask spread could be amortized over the holding period. Therefore, the longer the holding period, the less meaningful a component of the total cost of ownership the bid-ask spread will be.
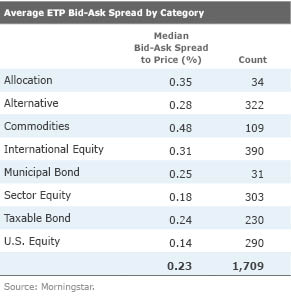
The second pattern that emerges from the data speaks to the relationship between an ETP's bid-ask spread and the liquidity of its portfolio constituents. The next table shows the median bid-ask spread by category group. Here, I chose the median rather than the average as there are many ETPs with low asset levels, which results in an upward skew to the equal-weighted average bid-ask spread. As we would expect, ETPs that track benchmarks composed of very liquid underlying securities, such as U.S. stocks, have tighter spreads than those tracking less-liquid securities (bonds) or those that trade on exchanges whose local market hours have little or no overlap with U.S. trading hours (international stocks).
The Case of the S&P 500 ETFs
Differences in trading costs can help explain why one ETP is more popular than another, despite having higher holding costs. The best example of this is
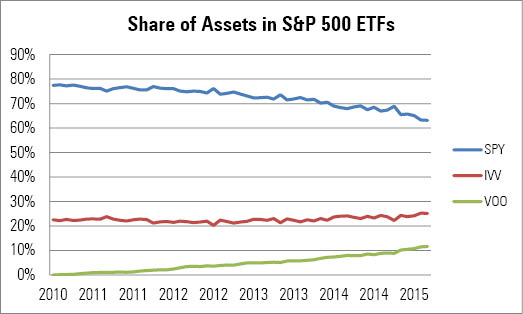
Despite SPY's higher holding costs relative to IVV and VOO, SPY claims 63% of the total assets invested among the three funds. Though SPY has been less efficient at tracking its bogy, it trades an astounding $24 billion a day, making it the most heavily traded security on the planet. The tremendous liquidity results in average bid-ask spreads of just one half of 1 basis point. That's tighter than any other ETP and amounts to just $4 for a $100,000 trade. For IVV, the average bid-ask spread over the 30 days through June 19 was 1 basis point, and it was 1.1 basis points for VOO.
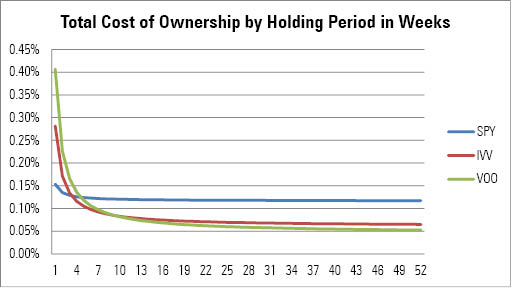
For a trader moving a large sum of money over a short period of time, SPY's lower trading costs trump its relatively higher holding costs in tallying the total cost of ownership. However, in recent years, the cost of trading IVV has fallen. While VOO has the highest trading costs among the three funds, it has the lowest holding costs and should be cheaper for long-term investors. The chart below illustrates this pattern. It shows the total cost of ownership based on a $5 million trade. The calculation is an estimate of the total cost of owning these funds and is composed of both trading costs and holding costs. Because trading costs are only incurred when trading, they will be a larger component of total costs for shorter holding periods. Over longer periods, the holding costs will become more important, as the trading costs will be amortized over a longer period of time. All else equal, the larger the dollar amount of the trade, the larger the trading costs will be. The costs are annualized and expressed as a percentage similar to an expense ratio. So for a one-week holding period, annualizing the cost means that we can assume the ETF is bought and sold every week over the course of one year. A 26-week holding period would imply buying and selling the ETF twice in a year.
The holding period, measured in weeks, is plotted on the horizontal axis. We would expect costs to fall over time since the longer the holding period, the more the trading costs get amortized. For holding periods shorter than a couple of weeks, SPY is the cheapest option. For holding periods between two and 24 weeks, IVV is the cheapest. Beyond that, VOO is the cheapest. As you can see from the exhibit below, VOO is the most expensive over very short holding periods because it has the highest trading costs.
Source: Morningstar.
SPY's lead in liquidity may be slipping. Between the three funds, SPY's 63% share of assets is down from 78% five years ago, as can be seen in the exhibit below. SPY's share of dollar volume has also declined, albeit more slowly. Among SPY, IVV, and VOO, SPY now has 96% of the trading volume compared with 98% five years ago. It takes time for a more efficient ETP to wrest market dominance from a more liquid ETP, but it can happen. Back in 2010,
Source: Morningstar.
In summary, a fair comparison of the costs of ETP ownership should include an analysis of trading costs such as the bid-ask spread. Both the liquidity of the ETP and that of its underlying holdings influence trading costs. While short-term traders may place a bigger emphasis on trading costs, over longer time horizons, holding costs become a more important factor.
Disclosure: Morningstar, Inc.'s Investment Management division licenses indexes to financial institutions as the tracking indexes for investable products, such as exchange-traded funds, sponsored by the financial institution. The license fee for such use is paid by the sponsoring financial institution based mainly on the total assets of the investable product. Please click
for a list of investable products that track or have tracked a Morningstar index. Neither Morningstar, Inc. nor its investment management division markets, sells, or makes any representations regarding the advisability of investing in any investable product that tracks a Morningstar index.
/cloudfront-us-east-1.images.arcpublishing.com/morningstar/T2LGZCEHBZBJJPPKHO7Y4EEKSM.png)
/d10o6nnig0wrdw.cloudfront.net/04-18-2024/t_34ccafe52c7c46979f1073e515ef92d4_name_file_960x540_1600_v4_.jpg)