
While Everyone Is Watching the Fed, the Economy Slips
The U.S. economic data isn't hanging together in a nice neat package.

Markets this week were almost consumed with watching the U.S. Federal Reserve, selling off before the meeting, and rallying after the Wednesday announcement and press conference where the Fed took a slightly dovish tone. The Fed even managed to push the Greek circus out of the headlines, at least for a day or two. Most markets were little changed for the week, including the bond market after this week's up-and-down, Fed-induced fake-out.
While everyone was busy watching or anticipating Fed action, the U.S. economy took a quiet turn for the worse. Housing starts were down and permits, adjusting out data from the Northeast, were basically unchanged. We had been hoping like crazy that the housing market would step up to aid slumping export and manufacturing sectors. So while a little better, the improvement just isn't enough to move the economic needle.
Speaking of manufacturing, the two-month improvement we had seen in the manufacturing-only segment of industrial production came to a halt in May. The headline IP number that includes the oil business and utilities managed its sixth month in a row of decline. Even inflation kicked up a little in May as gasoline prices jumped 10% in a single month, which was not good news for the consumer. Shopping center weekly data also continued to deteriorate, indicating that consumers are still reluctant to spend their extra earnings or their gasoline savings.
We are in one of those periods when all of the U.S. data isn't hanging together in a nice neat package. The hiring boom of last fall makes no sense in light of subsequent GDP growth that seems so anemic. In addition, all the gasoline savings, improved consumer confidence, and much better employment data have done little to improve consumption. In fact, we would be much more bearish on the economy if it weren't for a savings rate that seems high relative to recent history. Our feeling is that these savings would be eventually spent, causing a boomlet, but I am now beginning to doubt myself on this. Maybe the ageing demographic that I have been talking about in so many other contexts means the savings rate will power ahead in future years. Or, maybe it is just a matter of psychology and not economics. When will consumers let loose, at least a little? They certainly seem to have the balance sheet to do so. That is, unless the numbers are wrong and get revised away.
Fed Reduces Economic Outlook but Continues to Expect Rate Increases This Year The Fed statement this month remained obtuse. It seemed to indicate with its individual rate forecasts for the Fed Funds rate that there would be one or two rate hikes this year. The agreement on the fact seemed exceptionally high. On the other hand, it crimped its economic forecasts yet again for 2015. The one thing that it seemed adamant about is that the future course of its interest rate hikes was highly data dependent. The only problem is that it isn't telling anyone which pieces of data might be the most influential in its decision-making process.
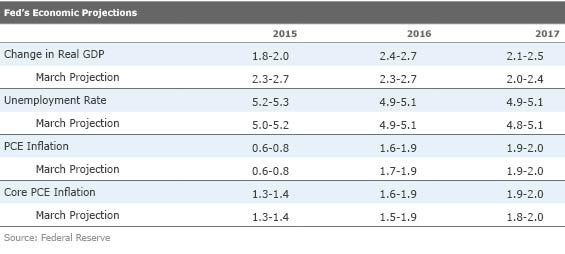
We guess the biggest surprise to us was how much it brought in its forecast for 2015. It is now thinking economic growth in 2015 is likely to be just 1.8%-2.0%. That worries me because it is even lower than my forecast of 2.0%-2.5% growth and the Fed is usually a wide-eyed optimist when it comes to the economy. It came to this low forecast despite expressing the hope (or knowledge) that the first-quarter GDP decline is likely to be erased in the next data revision. Interestingly, it claimed the first-quarter data was an anomaly that artificially depressed the 2015 growth rate, but then did hardly anything to 2016 and 2017 GDP estimates. If it truly believed the first quarter was an anomaly, it should have boosted its 2016 forecast. It also upped its short-term unemployment forecast--not a particularly good omen, either. And with the inflation rate so low and forecast to stay below 2% the Fed doesn't seem to have a lot of reason to pump up rates. I do continue to believe that its inflation forecast is too low given the budding labor shortage and increased wages.
On the rate side, the average forecast of the Fed governors suggests that the Fed funds rate should move from 0.1% currently to 0.6% by year-end. This forecast is still very close to its March estimate. Given the expectations of small rate hikes (say 0.25% or less), it implies that there could be two increases this year. The year-end 2016 rate estimate dropped modestly to 1.6% for 2016. That estimate for 2016 had been as high as almost 3% during summer 2014.
So as is the pattern, before the Fed announcement, markets sold off on worries of tightening hints. Instead, we got gobbledygook and the market loved it. This pattern is becoming entirely too predictable.
For the record, I continue to think the Fed receives way to much attention. There are other central banks that may be nearly as influential on worldwide rates. And if the Fed's action, or inaction, were totally out of line, bond buyers would vote with their feet. We note that 10-year rates in the United States and Germany have moved sharply higher in the past few weeks, even as the Fed does nothing. And the Fed's economic forecasts have been pretty wide off the mark, too.
Headline Inflation Picks Up; Core Inflation Still Calm The headlines this week all trumpeted the 0.4% inflation rate between April and May, which annualized to a rate just under 5%. The fearmongers went on to note that this was the biggest increase since 2013. Scary, right? Well, no, not exactly. On a single-month, year-over-year basis, there was zero inflation, compared with 0.2% year-over-year deflation in April. The quick drop and partial rebound in gasoline prices is responsible for the seemingly conflicting numbers. Excluding food and energy, prices were up 0.1% April to May (1.2% annualized) and 1.7% year over year. The core inflation rate has been at this level plus or minus a tick or two for over two years. The recent level is well below the 4% level that typically triggers a recession and well above levels that would indicate a deflationary free-fall. Below is the year-over-year data, averaged over three months, to remove some of the month-to-month noise.
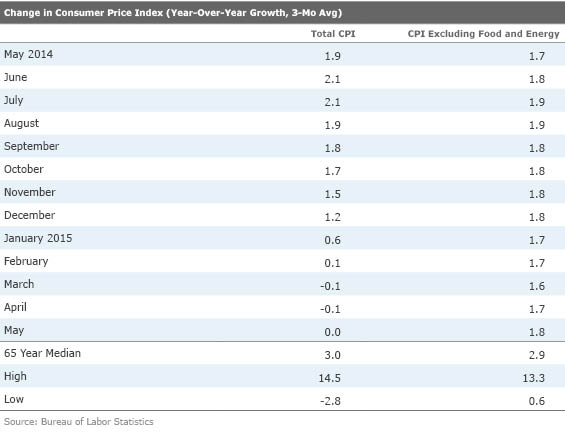
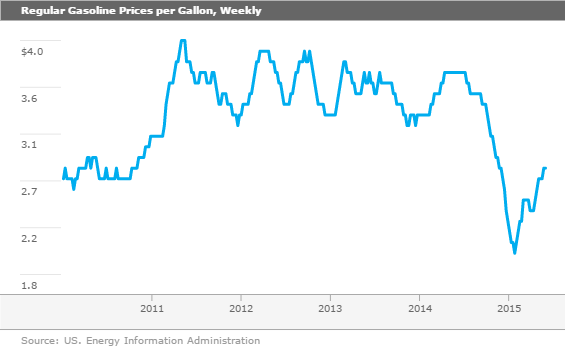
As we begin to lap the beginning of falling gasoline prices, the year-over-year inflation rate will again approach the core rate of 1.7% or so instead of the 0% rate, year over year, which we are experiencing now. The unwind process begins slowly as gasoline prices peaked the last week of June 2014 at $3.71 before falling all the way to $2.04 in January. Prices are now just about halfway back at $2.80 per gallon. It's a really good thing that consumers didn't spend all those gasoline savings as some of them were obviously illusory. Consumers may have figured that out before economists did.
Figuring out the exact role of gasoline in price indexes and consumer behavior is not easy. At just under 4% of the CPI, gasoline prices aren't a huge deal. However, gasoline alone, not even considering other energy products, fell 25% year over year and took close to 1% off of the year-over-year CPI calculation (year-over-year inflation would have been 1% instead of 0%). However, not everyone uses gasoline and some states are more affected than others. Also, urban areas are less affected than rural ones. Young people in big cities probably aren't benefiting from lower gasoline prices. Instead, young adults are being squeezed by higher rents. So, inflation rates are really a personal thing, not a one-size-fits-all type of calculation, as many readers have pointed out before.
Sector Inflation Data Shows Few Short-Term Issues but More Long-Term Concerns The month-to-month data, excluding that pesky increase in gasoline prices, looks more benign than it has for some. When our top four gainers list includes an item rising just 0.2% and a number of categories declining, the situation looks quite benign. Again, some of that is just noise, and offsets some pretty strong gains in April rather than another bout of deflation.
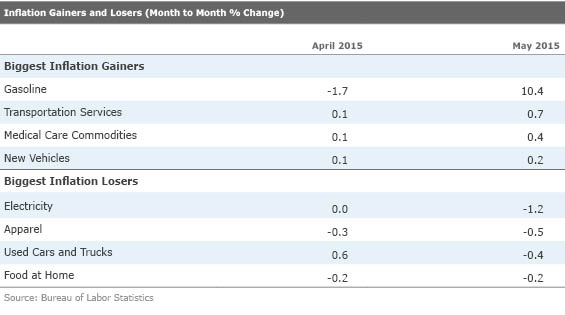
Still, we were very pleased to see the deflation in food-at-home prices for the second month in a row. Food prices, especially meat-related, created some real problems for consumers last year. Food eats up much of consumer budgets, is hard to evade, and hits low-income workers particularly hard. Year over year, grocery prices are up just 0.6%. The end of the drought in the Midwest and now Texas has finally brought food prices down to earth, though beef prices remain high. Clothing prices have also resumed their downward plunge after a winter respite, caused by the West Coast port issue that artificially hiked clothing prices for three months in a row this winter. As goods return to the stores, apparel prices have resumed falling and are now down year over year again. That, of course, is wreaking havoc on the noninflation-adjusted retail sales data, making things look bleaker than they are.
While energy, groceries, and apparel represent the good news of the year-over-year data, there are a few problem categories, too.
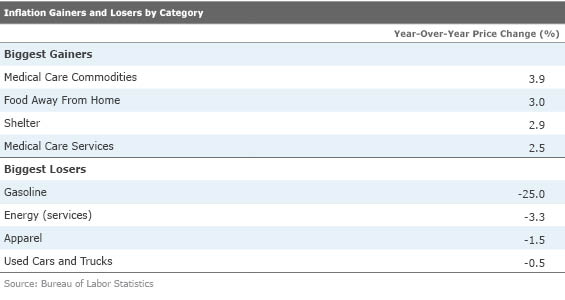
Unfortunately, medical-related items are becoming problematic after a period of tameness. Combined, medical services and products amount to about 8% of the CPI calculation, and combined are showing inflation of around 3%, far higher than the 1.7% overall inflation rate excluding food and energy. With fewer drugs losing patent protection, some industry consolidation, and higher demand for services under the Affordable Care Act, prices are likely to remain problematic in the months and years ahead. Shelter prices--both cash rents and the owner equivalent rent--also continue to move higher, with rents a particular problem. Rents are up 3.5% year over year, though are probably much worse in large urban areas. While we keep hoping that the higher rents finally motivate young families to buy a home, it appears that higher rents are also keeping them from saving up the cash to make a down payment.
Industrial Production Worse Than We Expected We have been warning of a soft manufacturing sector since last fall. However, the port strike resolution, better durable goods orders, and a bottoming in a lot of purchasing manager surveys gave us some hope that the May numbers for industrial production would look better.
They didn't. Headline industrial production fell by 0.2% between April and May instead of gaining 0.2% as the consensus had hoped. The headline number is now down six months in a row and hasn't had an uptick since November. Even stripping out mining (which is mainly oil production and a little coal) and utilities, the manufacturing-only component was down by 0.1% after two months of small gains. The year-over-year data is showing that growth is trending down quickly, but it is causing at least some manufacturing observers to note that we might be entering a manufacturing recession.
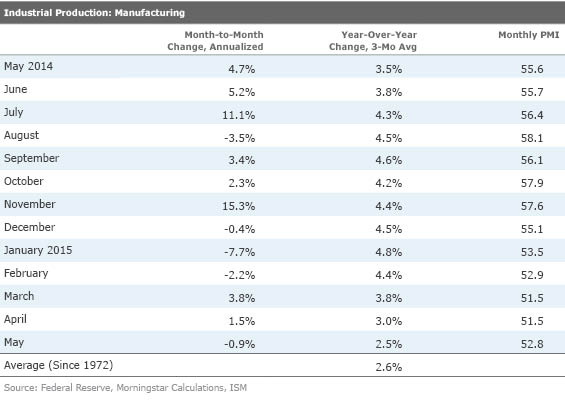
With some unusually strong manufacturing numbers last summer, it appears those year-over-year numbers, even averaged, could get close to an outright decline this fall unless things accelerate soon. Remember, manufacturing accounts for between 10% and 12% of U.S. employment and wages. It also drives a lot of capital spending and benefits a lot of other sectors. So this week's report certainly wasn't welcome news.
Manufacturing sector data seemed to indicate that the weakness in May was broad-based. Food (we can't explain why food production is down five of the past six months), paper, chemicals, aerospace, and oil refining were all down month to month. Without a 1.7% gain in autos, the numbers would have been even worse. Other gainers included primary metals, machinery, computers, and plastics. The magnitude of the changes was greater for the losers than the gainers. Losses were usually big and gains small.
Although we usually don't track the mining and extraction sector of the industrial production report, we couldn't help but notice this sector was down for five months in a row and is down 0.3% year over year. Surprisingly, while oil production growth has slowed some, it is still growing, just not as fast. What's fallen to pieces and has dragged the index down is oil exploration services that are down over 50% so far in 2015. That's bad news again for the GDP calculation because even in tiny categories, changes this large can move the GDP calculation around, especially when the base growth rate is not that large and a quarterly shrinkage is annualized.
While I am still hopeful about at least a bounce in manufacturing, no clear engine of growth is visible. Energy sector growth could come back some, but it will never be what it was in its heyday. Auto growth rates continue to shrink and total auto sales may be close to sort of a cyclical peak. Commercial jet activity could improve a little more but slower defense spending is holding back the combined aircraft market. Mining equipment and farm equipment may also continue to face pressures. And the boom in chemicals and plastics may not come because of a stronger dollar and falling energy prices for U.S. competitors. The United States is not the only place with cheap energy inputs anymore. Housing will be one potential bright spot, but that may not be big enough or grow fast enough to offset other manufacturing issues. Too, I can't imagine that food production will continue to go down.
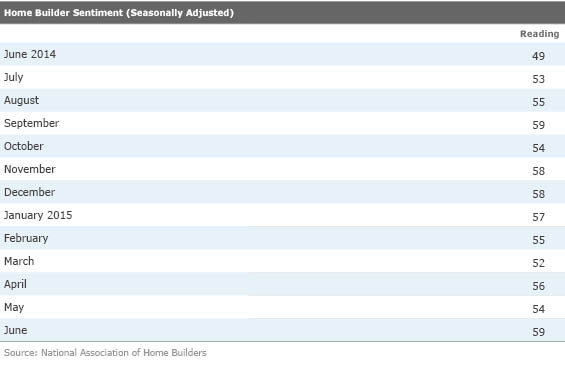
Builders Feeling Better The builders, a normally fairly bullish group, felt even better than usual in June. The overall index made a large jump in June, moving from 54 to 59. Other than another reading of 59 last September, this is the best sentiment number of the recovery. A reading over 50 indicates that more builders see more favorable conditions than negative conditions. All three components of the index--current sales, buyer traffic, and the future outlook--all moved up in nearly equal amounts. Regional data showed relatively similar gains, although the Midwest reading showed the most improvement. One other bright spot is that housing permit growth accelerated nicely after the high reading in September. Hopefully, it will bring the same good luck this summer.
May Housing Permit Data Artificially Strong; Starts Settle Back Down Again We had yet another month when starts went one direction and permits went the other. Starts were down 11% while permits were up 12%. Bad weather might have delayed starts in many parts of the country, especially in Texas and the Midwest. Weather isn't the whole story, though, as fewer weather-affected multiunit buildings were particularly soft. All regions, not just the weather-affected states, saw housing starts decline. Also, starts were unusually good in April, which led many economists to expect at least a modest downturn in starts. So the rush to start units in April combined with bad weather in May makes the month-to-month starts data look worse than it was. Permits, on the other hand, hugely benefited from an expiring tax benefit in New York City that caused a huge boom in permits for May for the Northeast region. Without the Northeast sector, permits were unchanged between April and May instead of showing a monster gain.
My guess is the single-family permits data, averaged over three months and compared with the same period a year ago, probably reflect the true state of the housing market. This excludes the ups and downs of the apartment market, short-term weather issues, and seasonal adjustment factors.
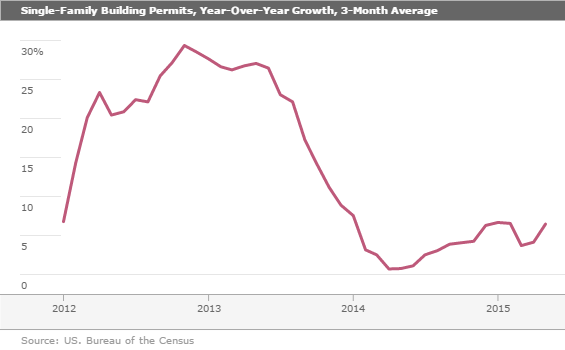
The story here is one of steady, unspectacular growth. At least we are moving up and to the left on the chart and permit growth is running around 6%. Thanks to the New York City situation, multifamily permits are up a stronger 15%. Without that gift from New York (which probably just pulled ahead permits), multifamily permits would also have been up around 6%. This is not enough to offset weakness in other parts of the economy.
On Tap: More Housing and Manufacturing Data and a Third Read on GDP With relatively bad news on starts and permits this week, we are hoping for better news on existing-home sales and new home sales next week. Existing-home sales made a surprise dip in April from 5.21 million units to 5.04 million despite pending home sales that were still OK if not great. The subsequent pendings report looked fantastic (a recovery high) and should help boost existing-home sales back to something as strong as 5.3 million units, tantalizingly close to the recovery high of 5.4 million units when buyers engaged in panic buying to avoid higher rates. That could provide a least a little bounce in the second-quarter GDP report. We could all use a dose of good housing news.
New home sales are also expected to look better given the strong builder sentiment report this week. This report has looked stronger than many other housing reports as it includes sales of homes still on the drawing board, so it can be a tad more forward-looking than the bleak housing starts report that has had massive, weather-related booms and busts this year. The trend in new homes has looked a lot better than either starts or permits as "on the drawing board" homes don't count in those metrics. Nor do sales to antsy buyers purchasing homes already sitting finished on lots count as either a start or a permit in current reports. New homes sales growth is up in the 20% growth range, which is a lot better than even the single-family permits growth rate of 6%. It sure would be nice to sustain that new home sales growth with a report of 525,000 sales or more for May, which is the current consensus. That should eventually drag the starts and permits data up in the months ahead. Fingers crossed for some good news.
Economists are bracing for more bad manufacturing news, expecting headline orders to be down 1%, led by poor airline orders. Excluding the transportation sector, orders are still expected to be down 0.5%. The trend has been a little better lately and the dollar has been a little weaker, so we are hoping hard that the consensus is too pessimistic. Again, after the lousy IP report for May announced this week, we desperately need a piece of respectable manufacturing data.
Maybe the BEA will finally get the first-quarter GDP report to the right number. We started with a modest growth rate of 0.2% in the first estimate. That was revised to a 0.7% decline in the second analysis. Now with the third estimate due next week, we believe that the economy pretty much flatlined in the first quarter (zero GDP growth). The culprit for this month's upgrade is likely to be an improved retail sales report and another look at services-related consumption, especially health care.
Next week also brings May consumption data, which should help everyone lock in their second-quarter consumption and GDP growth rate forecasts. Analysts are expecting a real barn burner with consumption up 0.8%, incomes up 0.5%, and a decline in the savings rate. We warn that an inflation gain of 0.3% or 0.4% (based on the already released CPI figures) takes away at least some of the luster of these strong reports. We also caution that the May selling day count in the auto industry gave the auto sector a massive, artificial boost that is likely to reverse itself in June. No matter what the monthly auto sale gyrations show, there is just no hiding the fact that auto sales growth is close to hitting the wall, pulling one of the legs out from under this economic recovery.
Here's to hoping for better economic data next week.
/cloudfront-us-east-1.images.arcpublishing.com/morningstar/T5MECJUE65CADONYJ7GARN2A3E.jpeg)
/cloudfront-us-east-1.images.arcpublishing.com/morningstar/VUWQI723Q5E43P5QRTRHGLJ7TI.png)
/d10o6nnig0wrdw.cloudfront.net/04-22-2024/t_ffc6e675543a4913a5312be02f5c571a_name_file_960x540_1600_v4_.jpg)