
Good News Is Bad News Once Again As Stronger Employment Growth Spooks Markets
The suddenly positive economic news was a bit of a shocker for investors this week.

It was an equal opportunity market this week with bonds, U.S. stocks, world stocks, and commodities all taking a hit. Almost all the weakness was derived from stronger U.S. economic data and a statement by European Central Bank President Mario Draghi suggesting that the European economy was perhaps stronger than believed. All of this positive news sent bond owners into a near panic with a Fed rate rise now anticipated to come sooner than thought. With little liquidity in some bond markets rates at a low point and rates bordering on the silly side (think negative rates) just the slightest whiff of Fed tightening sent traders scurrying. Just as one example, the German 10-year bond rate soared from just 0.05% in mid-April to as high as 0.9% this week, before settling at 0.85%. Even the U.S. 10-Year Treasury Bond has gone from a yield of 1.7% in late February to a 2015 high of 2.4% on Friday. Higher bond yields generally hurt risky assets--the riskier, the worse the result. That's probably why the U.S. market was able to escape the week with a 0.7% decline while Europe declined well over 1% and emerging markets pulled up the rear as they have for several weeks with a loss of 2.5%.
Although problems had been brewing in European bond markets for several weeks, the suddenly better economic news for the United States, following weeks of disappointing data, was a bit of a shocker for investors. A series of very positive (even if somewhat artificially inflated) data lit up markets with fear that growth would rebound sharply in the summer months, just exactly like it did in 2014. And that better economic outcome was likely to push the Fed over the edge and force its first rate increase by September. So good news is bad news once again.
This week's litany of good news included recovery high auto sales for May, the largest increase in overall construction spending since 2008, improved manufacturing statistics, a sharply improving trade deficit for April, and finally, an unusually strong employment report showing 280,000 jobs added for the month of May. Even hourly wage growth looked good for a refreshing change. Though I could find something to quibble about in almost every report (as described in more detail later), the economy is clearly doing better after a combination of bad weather and West Coast port issues toppled the first-quarter GDP report. It now looks like a replay of last year when everyone started the year way too optimistically, then bad weather made everyone too pessimistic, and now everyone is scrambling for the other side of the boat yet again as April and May data comes roaring back. Meanwhile, through it all, we are sticking to a 2.0%-2.5% GDP growth forecast for as far as the eye can see. Sure, consumers, housing, and overseas activity are due to pick up, but demographics will continue to keep a lid on growth that is still not fully appreciated by the market. Higher interest rates won't help matters, either. However, potential homebuyers should be in full panic mode starting next week as they scramble to get a deal done before rates move even higher.
Employment Growth Remarkably Strong in May The U.S economy added 280,000 nonfarm payroll jobs in May, surpassing the consensus estimate of 220,000 and our estimate of just 200,000 jobs. Certainly there was some help from the addition of summer jobs in some industries, but generally it was a very strong and clean report. The jobs data also exceeded the 12-month average of about 255,000 jobs per month. And like so many other data points, it appears that the economy is coming off its weather and West Coast port issues that temporarily depressed a wide range of economic statistics. The job growth average for the January through April was a mere 200,000 or so jobs added per month, well below the annual averages and a sharp falloff from a very strong autumn. Viewed on a year-over-year, averaged basis, the jobs market has been consistently strong since September 2014. The private sector employment rate has been growing at about a 2.6% rate. Adding in the lethargic government sector, nonfarm payrolls are expanding at a very healthy 2.3% rate.
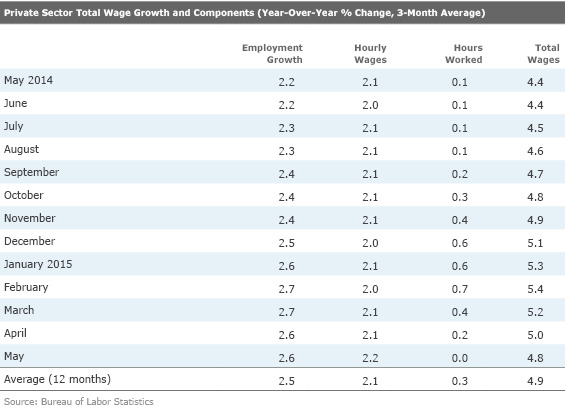
Wages Push Higher at Last Month-to-month wage progression was also robust at a 0.3% monthly rate (3.6% annualized) and some previous data was revised, perhaps confirming the overall strength of the jobs market. Though less dramatic, the year-over-year hourly wage growth rates also appear to be improving. Growth in hourly wages and the number of workers added are relatively similar at 2.6% and 2.2%, respectively. While the market always focuses on the jobs number, wage growth is nearly as important. At this stage of the recovery, hours worked provides little help to wage growth and that is the case again now, as shown below. Combining all three factors, employees, wage rate, and hours worked, total wage growth has been little changed at about 5%, plus or minus a couple of tenths, back to October.
The wage trend looks even better when adjusted for much lower year-over-year inflation. That said, the spike down in gasoline prices probably makes this metric look better than it really is. Remember the hyperlow prices of January, when gasoline temporarily fell to under $2 per gallon in some markets.
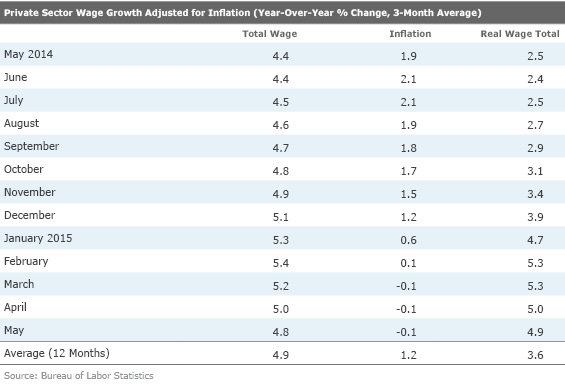
As labor markets continue to tighten from demographic problems and year-over-year inflation rates no longer benefit from falling gasoline prices, it will be very interesting to see if employees are able to extract more money from their bosses to make up for the higher inflation. If markets are as tight as we believe, I suspect that wage growth will remain relatively high.
Hourly Wage Growth Data Not as Dour as Many Suggest Many observers have been complaining about growth in hourly wages for some time. I think some of these folks forget that wage growth has been lackluster for decades. The graph below shows that inflation-adjusted hourly wage growth has seldom exceeded 2% for long and that there were vast periods when real wages in the 1980s and 1990s didn't grow at all. In fact, the current growth rate of 1.7% exceeds over 77% of the periods observed since 1965. Low wage growth was obscured by increasing numbers of workers per household, high inflation, and high borrowing levels. A ready supply of workers and the ability to shift shops to lower-wage areas has been going on for at least 60 years beginning with mills in the U.S. Northeast heading to the Southern U.S., then Mexico and then China and now Vietnam.
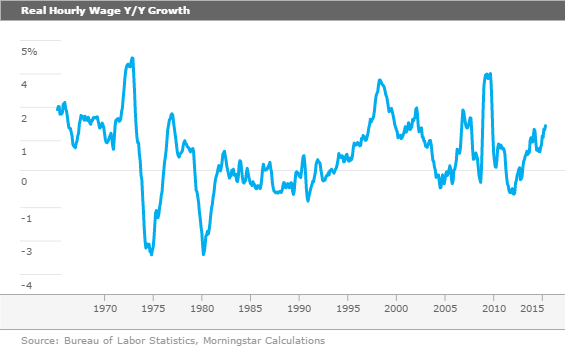
I suspect that shifting demographics and lower population growth could keep wage growth running higher than its historical average (a measly 0.7%) for years to come. The current 1.7% real growth rate could even accelerate in the months ahead as it already has over the past year.
Government, Amusement Parks, and Health Care Lead Job Parade While Mining Falters The sector data was relatively unspectacular this month, with no one sector changing all that much from its 12-month trend. Government, which has barely added any jobs, recently managed to add 18,000 people, primarily in the local government sector during the month of May. Health care, which had been lethargic for several months, saw accelerated job growth. A lot of that growth came in home health-care-related settings. The other positive outlier was the arts, entertainment, and recreation sector. That broad category includes sports and theater venues as well as amusement parks. Strong gains here may have been related to summer hiring/kids out of school. On the negative side, the mining- and oil-related sector continued to deteriorate with 18,000 jobs lost in May. Manufacturing was relatively weak, adding just 7,000 jobs. Meanwhile, construction added 17,000 jobs, just below trend.
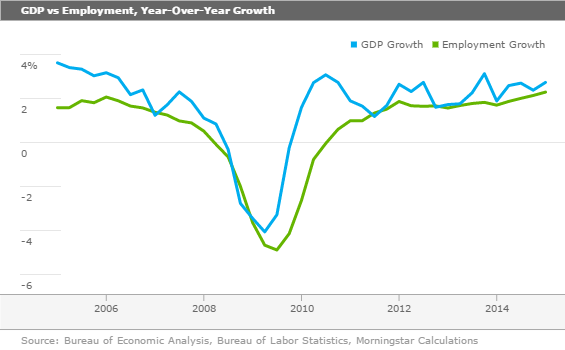
GDP Data Hasn't Looked Nearly as Good as Employment Growth Would Suggest While we like all the job growth and acceleration we have seen recently, it still doesn't fit nicely with all of the GDP data. GDP and employment growth can't stray far from each other over time as labor is the key input to producing goods and services. In general, GDP growth should be greater than employment growth because of productivity. Unfortunately, that gap has closed a lot over the past couple of decades. While the spread between GDP has averaged 1.5% over the past 20 years, it has averaged just 0.5% over the past two years, suggesting that new workers haven't been very productive, or really deserve much of a raise, at least in aggregate. Currently year-over-year GDP growth is running at about 2.7% while employment growth is running at about a 2.3% rate for a positive spread of 0.4%, lower than the historical average and even below the rate of the past two years. Unless something changes in a big hurry, that spread will become even narrower in the second quarter. After that, it would appear that either GDP growth needs to accelerate or job growth needs to falter or a little of each to bring employment and GDP growth back to historical trends.
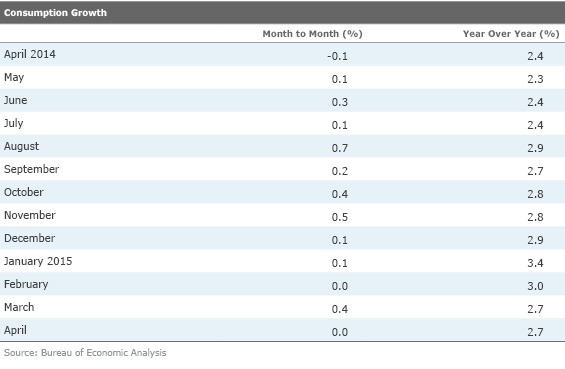
Monthly Consumption Data Looks Troublesome, Year-Over-Year Data Not So Much As we mentioned in last week's column, weather, port issues, and staleness make this report a little less useful than usual. The smoothness of year-over-year growth rates and unbelievably strong fall months followed by poor winter and spring data suggest there could be some seasonality issues with the consumption report. Certainly, auto sales have been distorted because of poor adjustment factors causing auto data to look way more volatile than it really is. And as we note below, auto sales were exceptionally strong in May, which will be a big aid to consumption in the second quarter and offset the pathetic reported numbers for April. The three big reasons consumption was little changed in April were the aforementioned artificial drops in auto sales, gasoline, and utilities sales. As we mentioned, auto sales have already bounced back, the drop in gasoline sales was large and has to be a statistical mistake, and utility sales continued on their typical roller-coaster path. Without these three items, month-to-month consumption growth would have been 0.3% or 3.6% annualized. That figure would be more consistent with the 2.7% year-over-year growth rate.
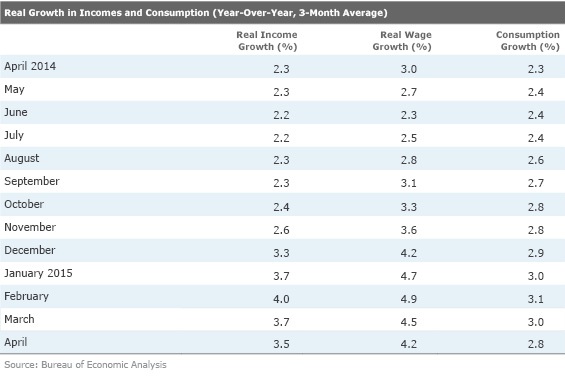
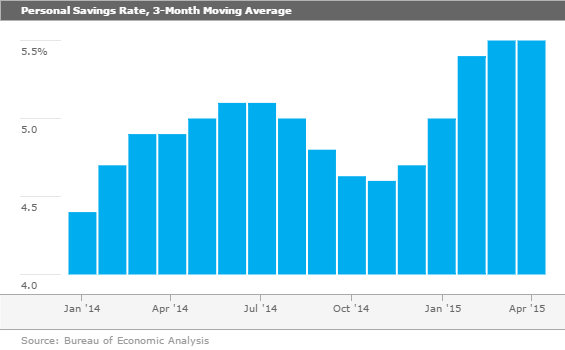
Savings Rates Going Up, But Not Because Consumers Are Trying to Save More The following table and graph suggest that for one reason or another, consumers are not spending all of their real income growth (which includes investment and rent income) or wage growth. Whenever that gap has become that wide, there has been a combination of a downward revision to earnings and an acceleration in consumer spending. We saw this very pattern last summer. We still aren't buying the theory that consumers have become prolific savers. Instead, we think it's a physical inability to spend money (poor weather, lack of imported goods) and a mismatch of when the GDP report suggests consumers are spending their money and when those bills are actually paid. (February's nasty utility bills, which counted in February consumption reports, were likely paid in April, potentially dampening April retail sales and consumption reports).
As Savings Soar, Consumers Have More Money to Spend in the Months Ahead
Purchasing Manager Data Confirms Manufacturing May Be Bottoming Durable goods orders have been indicating that the worst is over for the manufacturing sector for a couple of months. Now the ISM purchasing managers' survey is confirming that trend, as the composite manufacturing index showed a nice pickup in May. The index moved from 51.5 to 52.8 between April and May. The ISM commented that the current reading is consistent with GDP growth of about 2.8%, based on past correlations. Some of the ISM projections, based on old correlations, have proven to be a bit too optimistic. While it's nice to see the improvement, the index is still well below its 12-month high of 58.1 and just now off its annual low of 51.5. Hopefully, the better ISM numbers will show up in actual improvement in the official government industrial production report for manufacturing.
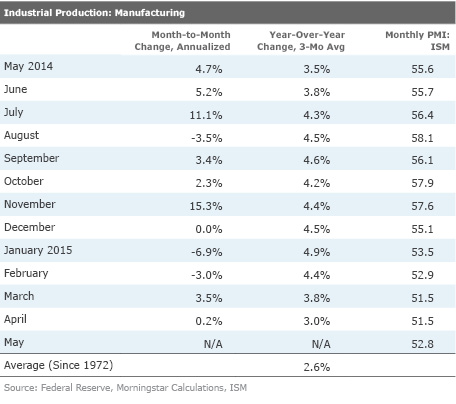
The improvements were relatively broad-based with 14 of 18 industries showing improvement, two unchanged and just two, Textiles and Computer Products, showing declines. The individual components also saw broad-based improvements with just current production, albeit from unusually high levels in April, and exports showing declines. With a reading of just 50 for exports, overseas shipments aren't a big part of the rebound in manufacturing we have seen thus far. Indeed, exports are likely to hold back manufacturing activity for the rest of the year. New orders and backlogs were particularly strong, increasing from 53.5 to 55.8 and 49.5 to 53.5, respectively, between April and May. These are the more forward-looking of the ISM components, so the manufacturing economy may have a couple of more good months in front of it. Recall that the New Orders Index started going up in April while the overall index didn't begin moving up until May. It appears that May wasn't a great production month, perhaps because supply chain issues related to the West Coast port issue slowed production capabilities. As orders picked up and as production faltered, the backlog of goods ordered soared. Those building backlogs should give manufacturers a little breathing room to expand in the months ahead.
Recall that manufacturing represents just under 10% of private sector employment and closer to 12% when one adjusts for wage rates and hours. Fortunately, the employment data, at least from the ISM, seems be indicating that hiring is picking up again as the employment component moved from 48.3 to 51.7, the best reading so far in 2015.
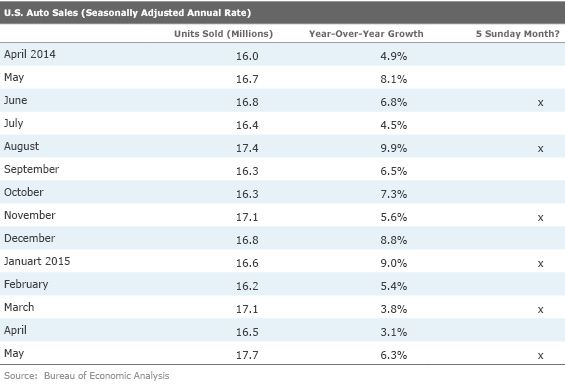
Auto Sales Look Great but a Little Too Good to Be True Headline auto sales for the recovery hit a new recovery of 17.7 million units on a seasonally adjusted, annual rate basis for the month of May. That's the highest figure since a 20.6 million unit reading in July 2005, a reading that was artificially inflated. Even the officially calculated year-over-year growth rate for May was a healthy 6.4%. However, comparing May 2015 with May 2014, without any selling day or seasonal factors, shows that sales grew a still OK but not great 1.6%. That got us to thinking why some of the year-over-year data from the automakers sometimes didn't seem as good as the government numbers. Also, we wondered why the month-to-month auto sales numbers seem so volatile.
Also fascinating is the fact that the months with five Sundays have been strongly outperforming the months on either side of the five-Sunday months. Is that another one of these weird, nonsensical correlations that just happen by chance? (For example, the winner of the Super Bowl correctly predicted the stock market a very high percentage of the time for decades.) We think not. Government statisticians take actual auto sales in five-Sunday months and boost them by an additional 4% or so. The original thought behind this scheme might have made some sense years ago when almost all auto dealers were closed on Sunday. Now it seems kind of daft with auto dealers in 33 states open on Sunday. And it may even be a pretty good sales day with lots of weekend shoppers. And with the Internet, the shopping process may not be as long or as complicated, making sales less dependent on the number of days outlets are open. The Sunday addition factor, which artificially boosts the sales count, is compounded in months with five Saturdays. Saturdays happen to be the bestselling day of the week. We can test out that thought on January 2015. There were five Sundays that month, but there were only four Saturdays. Sales in January were OK relative to proximate months, but not as stellar as some of the other months. Conversely, May 2014 was a five-Saturday, four-Sunday month, which was also a relatively strong month.
All this analysis is a very long way of saying that May was a decent month for auto sales, but not nearly as strong as the 17.7 million SAAR would seem to suggest. This is not the start of runaway growth. By the way, June is just a four-Sunday, four-Saturday month, so I suspect that the reported SAAR will drop back to under 17 million units. Now you know; that would be no reason to panic.
Certainly not panicworthy, but auto sales growth continues to decline.
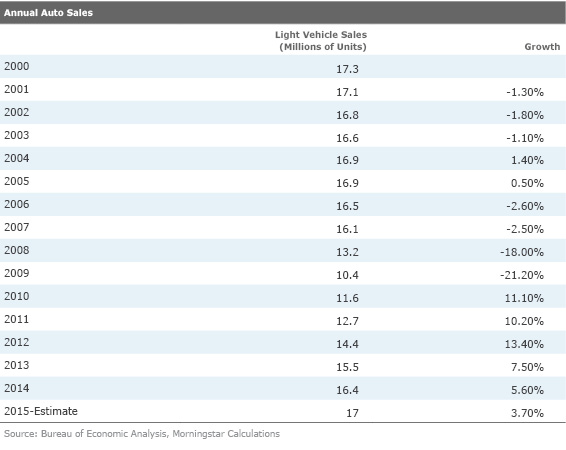
On a full-year basis, total light car sales would be better than at any time all the way back to 2001, if indeed we get to 17 million units in 2015. With more people and more income, that isn't the world's greatest news, but we guess we aren't to the peak of this cycle just yet, either. Note that since 2012, the growth rate of auto sales has been declining and we suspect that growth is likely to be under 4% for the full year, as shown above.
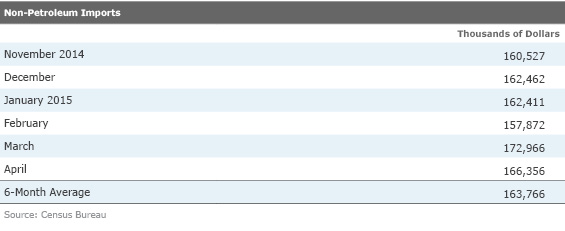
Net Exports Shouldn't Kill GDP Growth in the Second Quarter, but Not Out of the Woods Just Yet There were a lot of headlines this week about a record drop in the level of the trade deficit. That's great news for the second-quarter GDP. (Trade depressed first-quarter GDP by almost 2% and is likely to have zero impact either way in the second quarter; that's an impressive 2% swing with no other growth.) However, that up-down pattern was mainly due to the slowing of Chinese imports to the U.S. West Coast in January and February, and a massive one-time port cleanup in March that continued some in April. Despite the good news for the second quarter, the long-term trend in imports is still intact.
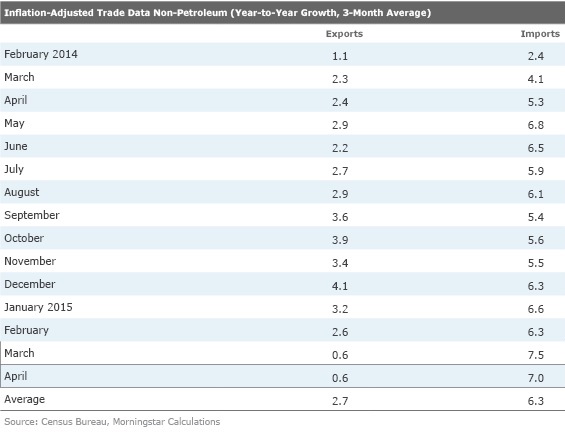
Exports, which were less hurt by the port labor action, continue to take a pounding with non-petroleum export growth falling to less than 1% in March and April, as shown below. So enjoy the short-term relief in the trade deficit while you can here in the second quarter.
Retail Sales, Job Openings, Small Businesses, and Federal Budget Comprise Thin Data Week With better weather and more goods on the shelves, there is some hope that retail sales for May will break the pattern of relatively poor month-to-month consumption growth. Better auto sales would seem to indicate that consumers are indeed more willing to open their wallets. With consumption making up 70% or so of GDP, the economy could really use a good report on Thursday. The headline figure showed no growth in April and economists are anticipating a 1% growth rate in May. Even that may prove to be too low because of the high auto sales numbers for May that we have already seen. Still, even without autos, the consensus is for 0.9% growth in overall sales.
The job openings report for April should give us some hints if the stellar May employment report was just a statistical fluke. The key numbers to watch are the number of openings, which I still hope are above 5 million, and the quits rate, which is not accelerating as quickly as I hoped. I don't care about the small-business sentiment report overall, although I always scour the employment metrics, since most of the hiring recently has come from small businesses. The federal budget deficit should shrink again for May compared with a year ago, but this is not a key revenue month like April was. The big worry here is some type of one-time, random true-up that shows up unexpectedly. These have included student loans and Medicare and Medicaid adjustments in the past.
/cloudfront-us-east-1.images.arcpublishing.com/morningstar/54RIEB5NTVG73FNGCTH6TGQMWU.png)
/cloudfront-us-east-1.images.arcpublishing.com/morningstar/ZYJVMA34ANHZZDT5KOPPUVFLPE.png)
/cloudfront-us-east-1.images.arcpublishing.com/morningstar/MNPB4CP64NCNLA3MTELE3ISLRY.jpg)