
Navigating NAV
We delve into the similarities and differences between stock price and net asset value, as well as some better tools for gauging a fund's attractiveness.
/s3.amazonaws.com/arc-authors/morningstar/3a6abec7-a233-42a7-bcb0-b2efd54d751d.jpg)
Question: Why don't you show 52-week high and low NAVs on your fund quote pages?
Answer: Many people think of a mutual fund's net asset value the same way they think of a company's stock price. But there are some crucial differences between the two. Here, we'll examine those differences and why they are key to answering the question. We'll also explore better ways to qualitatively evaluate mutual funds and measure their performance.
How Is NAV Like a Stock Price?
There are similarities between a mutual fund's net asset value and a stock's share price. Each represents the price of one share of an investment. For a stock, this is simple: A share of
A mutual fund's per-share NAV is similar, but slightly different. A fund's net asset value is calculated by taking the value of its assets (such as stocks, bonds, and cash), subtracting its liabilities (such as expenses), and dividing by the total number of shares outstanding. For example, as of the Dec. 31, 2014, semiannual report Dodge & Cox files with the Securities and Exchange Commission,
Stock Price and NAV Move for Different Reasons That's where the key similarities between a stock price and NAV end, however. Stock prices are influenced by the forces of supply and demand, whereas a fund's popularity--or lack thereof--has no bearing on its NAV. When more investors become bullish on the company, its stock price rises because the company has a finite number of shares in the open market. If a company wants to change the overall number of shares, it would need to issue more shares, which would lower the stock price, or buy back more shares in the marketplace, which would increase it (other things being equal).
A mutual fund's per-share NAV, on the other hand, isn't affected by whether investors are buying in droves or redeeming their shares. An open-end fund creates new shares when new money is invested, and when investors redeem their shares, the fund pays them their money back, normally by dipping into cash on hand or selling securities to raise cash. A fund's net asset value increases or declines if the value of the underlying securities increases or declines or if the fund makes a distribution to shareholders, which we will explain next.
Distributions Will Reduce a Fund's NAV Another difference between stock share prices and NAVs: Mutual fund NAVs can be affected by the consequences of tax regulations. Stock share prices aren't--at least not directly. When a mutual fund sells a security for a profit--say it buys a company for $10 and sells it when it's trading at $15--it can't retain that $5 gain but instead must distribute it to shareholders in the form of a capital gain. Such distributions reduce a fund's NAV but don't have a direct impact on a fund's published total return. (Note: These distributions usually happen in December, so if you're shopping for a mutual fund for a taxable account late in the year, you may want to time your purchase after this payout has occurred to avoid paying taxes on the distribution, especially since, as a new shareholder, you weren't even around to reap the gains! You can find information about fund distributions, including the total amount and scheduled payout date, on the fund company's website.)
To illustrate a distribution's effect on NAV, let's look at
If you looked at just the fund's NAV prices during the one-month period, it would seem like your investment lost a lot of money in December 2014--the fund's NAV started the month at $104.59, and ended it at just $92.99 on Dec. 31. Did the fund lose 11% in one month?
It actually didn't. Let's look at a Growth of $10,000 graph from Morningstar Direct, which examines how much a $10,000 investment would have increased in value during the same one-month period. (The y-axis here is the amount invested in USD; the x-axis is time.)
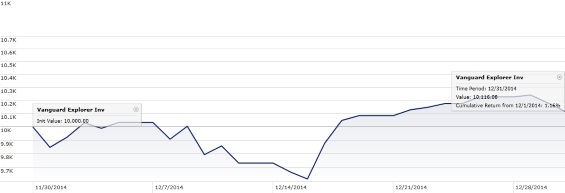
Source: Morningstar Direct (click here for an enlarged version).
Looking at this chart, you can see that $10,000 invested in the fund at the beginning of December 2014 would have a value of $10,116 at the end of the month--so a cumulative return of 1.16% during the period, not an 11% loss. When evaluating the past performance of your investment, pay attention to a fund's total return and not the movements of its NAV. Total return is calculated by looking at the beginning and ending values of an investment, taking dividends and capital gains into account. So, it gives a clearer picture of a fund's appreciation or depreciation over time. (Be sure to compare a fund's return with that of its category average or an appropriate market benchmark.)
Better Evaluation Measures Because NAV can be affected by factors unrelated to the value of the holdings, it's a mistake to use it as a gauge of either a fund's performance or its attractiveness. A dip or peak in a fund's NAV is not a good way to time an entry or exit point. NAV also says little about whether or not a fund is a good buy; a high NAV doesn't mean a fund is expensive, and a low NAV doesn't mean it's cheap. When comparing two funds with similar underlying holdings, buying a fund with a lower NAV doesn't mean that you're getting more for your money--nor does a higher NAV mean one fund has performed better than another.
Rather than focusing on NAV to gauge a fund's attractiveness, you'll want to dig beneath the surface. To assess whether a fund's holdings are cheap or dear, Morningstar's stock analysts use a valuation-based system to assign star ratings to individual stocks, so looking at the star rating for a portfolio's equity holdings can give you a sense of whether or not it's an opportune time to buy a fund. (This information is available on Morningstar.com; go to a fund's Portfolio tab and click on Premium Details.) You could also look at a portfolio's aggregate valuation ratios, such as P/E or price/book ratio.
And, of course, other important factors for both existing and prospective investors to consider when evaluating funds are expenses, manager tenure, investing style, volatility, and aftertax results.
/cloudfront-us-east-1.images.arcpublishing.com/morningstar/ZKOY2ZAHLJVJJMCLXHIVFME56M.jpg)
/cloudfront-us-east-1.images.arcpublishing.com/morningstar/IGTBIPRO7NEEVJCDNBPNUYEKEY.png)
/cloudfront-us-east-1.images.arcpublishing.com/morningstar/HDPMMDGUA5CUHI254MRUHYEFWU.png)
:quality(80)/s3.amazonaws.com/arc-authors/morningstar/3a6abec7-a233-42a7-bcb0-b2efd54d751d.jpg)