
The Last Thing the Fed Should Be Worried About: Deflation
The current run of tame inflation will likely end by the end of the year.

It wasn't a great week for markets, with most international equities, commodities, and bonds registering declines. U.S. markets were able to eke out just a tiny gain. Worries about a Fed rate increase and lackluster economic activity around the world kept a lid on weekly returns. Markets were particularly disappointed in a speech by Federal Reserve Chairwoman Janet Yellen suggesting that the first-quarter slowdown was temporary and that rates are likely to have to be raised sometime this year. Not exactly a surprise.
In economic news, the market was disappointed in the Markit Worldwide Purchasing Manager Reports that suggested various stimulus measures may have stopped the economic slide but that growth wasn't exactly bursting out all over. This week's U.S. news was mainly a mixed bag from the housing sector, with housing starts coming out of their weather-induced stupor while existing-home sales slumped modestly in April compared with a too-good-to-be-true number for March.
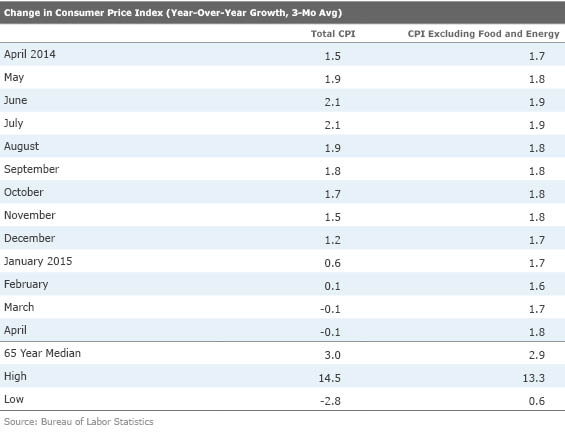
The most troubling report this week was the U.S. Consumer Price Index. Though soft in the month of April, CPI seemed to indicate higher inflation in the months ahead. Readings from the housing, medical, and energy sectors lead us to that conclusion. On the other end of the inflation picture, outright deflation in clothing prices, grocery prices, and personal items may be behind the mysteriously soft April retail sales report, which is not adjusted for inflation.
We share Yellen's belief that weakness in the first quarter was likely a result of bad weather, a port strike, and an adjustment to lower energy prices. Although slow consumer spending is still a bit of a puzzle, at least a few clues are beginning to appear. Utility bills for February, which were likely paid in April, have probably had a bigger and slower effect than many had anticipated. Massively higher tax collections, especially at the high end of the income scale, may have really pinched wealthy and semiwealthy consumers, especially in April. Tax collections for April were a stunning $40 billion-$50 billion above the government's own very recent forecast. Higher insurance bills and rents haven't exactly got customers in a big spending mood, either. Slow housing construction has left the market undersupplied, driving housing prices sharply higher. Did I mention that those wonderful gasoline prices are now 30%-plus off of their bottoms (in January), too?
Some, but not all, of these items have the potential to sharply reverse themselves in the months ahead. That is why we are sticking with our modest 2.0%-2.5% growth forecast for all of 2015, even in the face of what is likely to be a negative GDP report next week.
Weak Inflation Reading for April Belies Potential Problems Ahead On the surface, the Consumer Price Index for April was good news for consumers, growing just 0.1% between March and April, and prices declined 0.2% from April 2014 to April 2015. These levels matched investor expectations. However, excluding food and energy, prices grew 0.3% between March and April (3.6% annualized) and 1.8% year over year.
Usually, I don't particularly like looking at the CPI without food and energy (known as core inflation) because these are large parts of consumer budgets (a 22% weight in the CPI). Leaving out these sectors always seemed like cheating to me. In 2011, commentators tried to focus everyone on core inflation, which was low and told investors to ignore high oil and food inflation. That was a mistake. Consumption slowed dramatically in 2011, at least partially because of higher overall inflation levels. So generally, I like to look at inflation with everything included.
However, the good news on total inflation is likely to come to an end by the end of the year. Core inflation has remained remarkably stable at 1.8% or so since mid-2013. The ups and downs in total inflation are primarily due to the wild swings in energy prices. The persistence of the core inflation rate has really been remarkable. The bad news is that continually falling energy prices are unlikely to be sustained. This will potentially cause the total inflation rate to burst upward by the end of the year.
If the core inflation rate remains stuck at 1.8% and gasoline prices return to the prices of last December ($2.54 per gallon for December), the year-over-year, single-month inflation rate would move from negative 0.2% this April to 1.8% by December. If gasoline prices stay where they are at now ($2.75 per gallon), the total inflation rate could move to 2.2% in December and 3.3% in January and February 2016. This assumes that core inflation or food inflation do not get any worse. I certainly hope that gasoline prices come back down by year-end, but I doubt that we will ever get back to the $2.04 price of January. Gasoline prices are up a strong 35% since then. No wonder consumer spending has been lethargic lately.
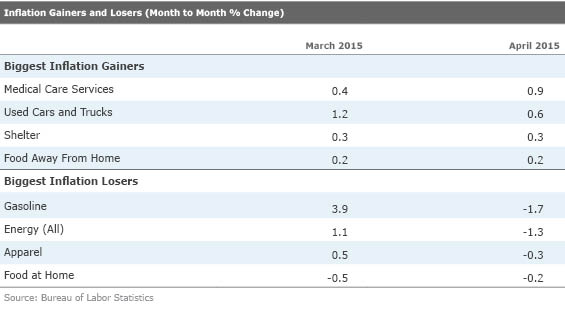
Sector Data Shows Some Pressure Monthly sector data on inflation is highly volatile, but nevertheless can sometimes reveal changes in trends and also explain some of the volatility in other monthly data series, such as the retail sales report.
The monthly data shows both inflationary and deflationary items. Medical care services, primarily hospitals, showed huge price acceleration in April, continuing to reverse unusually low price increases of 2014. While the price increases in hospital services are not likely to be as high as April's 0.9% rate, medical care inflation is likely to track generally higher as hospital utilization continues to go up. Used car and truck prices also spiked in April after a period of unusual declines. It didn't help that new car sales had been a little low, reducing the supply of trade-ins.
On the monthly down list, besides energy, both food at home and apparel prices were down. These lower prices may explain why the noninflation-adjusted retail sales report for April was so low. Clothing prices, grocery prices, and personal care prices all were down in April, depressing many categories of the retail sales report, including department stores, clothing stores, grocery stores, and even drugstores.
The year-over-year data shows some of our biggest concerns. The shelter category, which constitutes more than a third of the CPI report, seems to show inflation stuck above a 3% annual rate. Both the year-over-year and month-to-month data support an inflation rate of over 3%. Limited new supply of homes is likely to keep the prices of new homes, existing homes, and especially rental homes, moving sharply upward for the rest of 2015. If no other prices changed except shelter, the overall inflation rate would still be at least 1%.
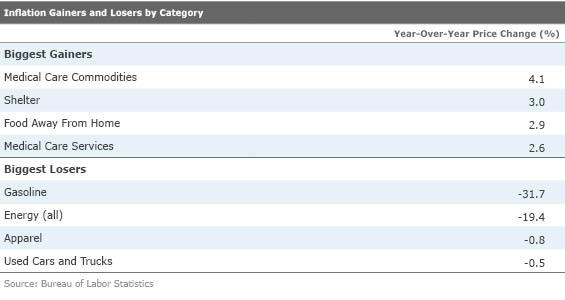
Year-over-year medical costs are also likely to remain relatively high in the year ahead with more demand for services, higher generic drug prices, and higher labor rates. This too will keep upward pressure on the CPI. And as mentioned earlier, the benefits of lower energy prices are likely to dissipate by the end of the year, even if energy prices don't change much from here. Overall, it appears that inflation could begin to be moving higher, with an inflation rate of over 2% likely for 2015 and more like 2.5%-3.0% for 2016. In our opinion, deflation or low inflation is just about the last thing the Fed should be worried about.
Flash Markit Manufacturing Data Another Mixed Bag China and Europe both saw very modest increases in their Manufacturing Purchasing Manager surveys. However, China's absolute reading came in below 50, indicating that more firms continue to see declines in their businesses than increases. Europe's absolute numbers were much better than China's and registered a 13-month high. Both the improvement in Europe and China were welcome, but at least a little disappointing given all the stimulus measures implemented months ago in both regions.
Meanwhile, the U.S. absolute reading was the best of the lot. However, the trend remains down, and the readings from the three regions seem to be converging. With a slowing energy sector and a strong dollar, the only surprise in the U.S. data was that the reading didn't deteriorate more.
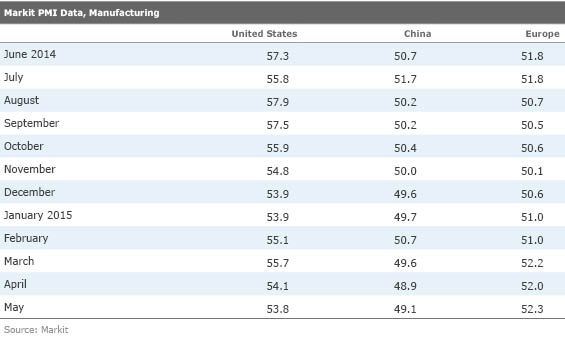
The details of the European report were intriguing with very good news and very bad news not too far beneath the surface. The headline looked quite good and is consistent with 1.6% annualized GDP growth rates for the second quarter, roughly on par with the recently announced first quarter. Markit went on to forecast that the eurozone could grow as fast as 2% in 2015, its highest reading since 2010. That looks a tad optimistic to us, but we can all agree that at least the downward momentum has been arrested.
New orders, the most forward-looking part of the index, registered a six-month high in Europe. Employment trends also looked strong. Many analysts cheered a sharp rise in input prices because it has quickly diminished the chance of a deflationary spiral. However, we were less than thrilled by the rise in input prices because prices that businesses could charge their customers barely budged, suggesting a potential profit squeeze. That is never good news for hiring or for spending on capital goods.
Also worrisome is that France and Germany both registered index declines and are now below where they were at the beginning of the year. These are the two biggest countries in the EU, and softness in these large countries is never a good thing.
Meanwhile, readings outside of the two giants were excellent. Output readings for all other EU countries combined are at their highest level since 2008. Our guess is the divergence is due to France and Germany's greater dependence on the U.S., China, and Russia. Those latter three countries have shown lackluster performance lately. Also, some of the peripheral countries were forced to implement real structural changes much earlier in the recovery process.
Data out of China continued to be troubling with yet another reading below the 50 level. Though the number is slightly higher than the previous month, new orders were also lower. Employment, though improved, was still below 50, which may make it hard to quickly ramp up production again. About the best thing that Markit could say about the data is that the numbers in general, and the price indexes in particular, left plenty of room for even more stimulus measures.
As usual, we will limit our discussion of the Markit numbers for the U.S. as we much prefer the monthly series from the ISM. However, to compare regions on an apples-to-apples basis, we always publish the Markit numbers in our world summary. The reason we prefer the ISM numbers over the Markit data for the U.S. becomes a little clearer from the table below. The U.S. industrial production data has shown a straight down pattern as has the ISM monthly data. The Markit data has been more ambivalent with more stops and starts and no particularly clear picture.
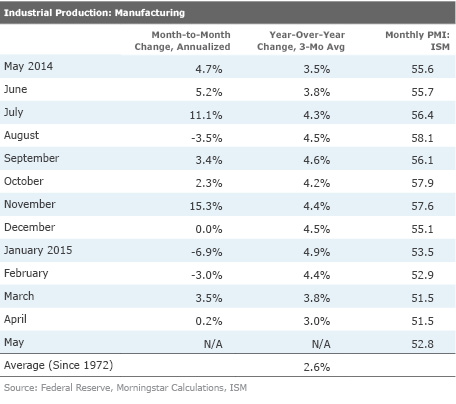
Can Housing Make Up for a Softer Manufacturing Sector? In 2014, the manufacturing sector in the U.S. was on fire, driven by the auto- and energy-related industries. In 2015, a slower auto market, a weaker export market (strong dollar and softer world market), and a slower energy sector have all combined to slow the manufacturing sector from almost a 5% growth rate (on a three-month moving average, year-over-year basis) to just 3% and falling. We had hoped the housing sector could make up some of the difference, but bad weather hurt the first part of 2015.
Weather and volatility have really complicated the analysis of the housing sector. The mixing of single-family building with large apartment building data has also confused some of the housing market reports. There are a few ways to try to make a little sense of the data. First off, we completely toss out looking at the housing starts data. Starts depend on weather, while getting a permit is much less dependent on weather conditions. And as a general rule, permits eventually turn into starts, it just happens in a different month. And because permits happen ahead of a start, permits are a better leading indicator of activity anyway. (There are two problems with this approach. First, some jurisdictions don't require a permit at all. Second, some permitted homes are never built, especially in a rapidly eroding economy.)
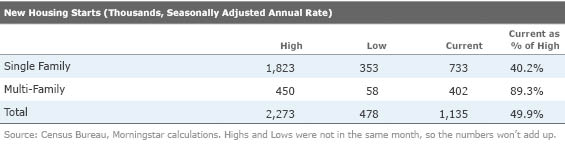
Also, splitting out the more volatile and fully recovered apartment (multi-family) market from single-family homes adds a little more clarity to the situation. The table below shows that the apartment market is generally much smaller than the single-family home market. However, the apartment market is now operating at 90% of its previous high, leaving little room for much more improvement. Meanwhile, the single-family market is operating at just 40% of previous highs, leaving a lot of room for potential growth.
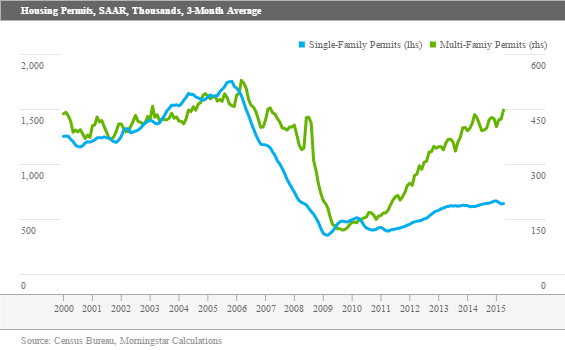
Using a separate scale for the smaller apartment market, it is easy to see that this market is approaching its old high. Although this graph is in units, one can easily see the stellar growth rates in apartments shown by the rapidly rising green line in the graph below. The blue line for single-family homes is far from its peak and rising more steadily, but at a slower pace.
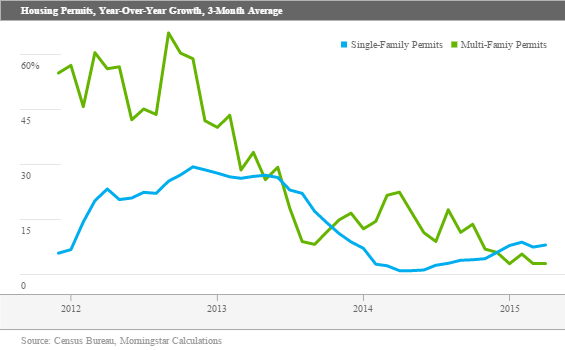
In fact, looking at the relative growth rates of the two markets, one can see a very rapid convergence in the two growth rates. At the moment the three-month, year-over-year growth in single family home permits, at 8%, exceeds the multifamily growth rate of just 3%.
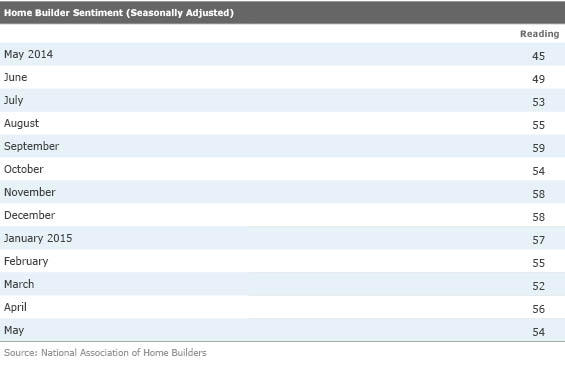
Builder Sentiment: Nothing to Worry About, in Our Opinion While builder sentiment did drop between April and May, the current reading of 54 is substantially higher than the reading of 45 a year ago. The current reading of 54 indicates that more builders are positive than negative on the market.
Interestingly, the outlook for six months forward component was up in May and very near the recovery high of 66, with a reading of 64. However, the traffic component of the index and the current conditions component were both down, pushing the overall index down. Maybe Internet shopping is keeping traffic down, with only the most promising homes getting an actual visit. Current sales closings may still be suffering from a lack of lookers during the winter months.
Month-to-Month Existing-Home Sales Remain on a Yo-Yo March existing-home sales were unusually good and came in way above expectations. Unfortunately, the data for April showed a dip in sales compared with March. However, we never want to get wrapped up in month-to-month numbers and were pleased to see the year-over-year growth rate in existing-home sales continue to increase.
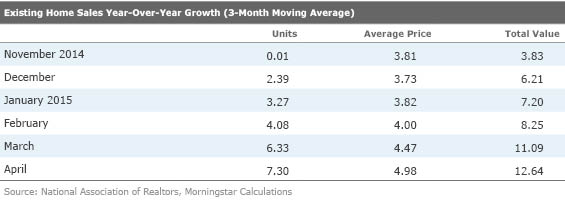
The increase in average home price suggests that markets are tight and without a lot of supply. The inventory data seems to support those price increases, with inventories barely budging year over year while sales have been increasing.
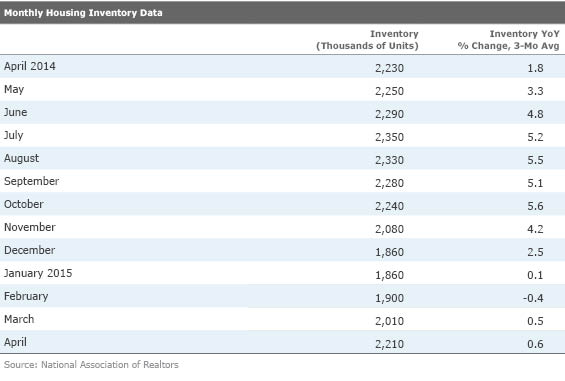
Since inventories are not seasonally adjusted (they go up every spring and down every fall) the year-over-year growth rate is probably the best way to look at the data. With unit sales growth of 7.3% and only 0.6% growth in inventories, conditions seem tight. Inventories for the single month of April were 0.9% lower than a year ago.
The National Association of Realtors remains convinced that demand is exceptionally high and that the problem remains with supply. Higher prices and the fact that 46% of homes were on the market for less than a month support this claim. As mentioned above, higher home prices and higher rents will play a big role in higher inflation rates in the months ahead. The NAR also warned that sometime after August, home closings could be slowed by new loan documentation requirements. It believes that could temporarily delay 10% of all closings for several months. Not exactly the news I had been hoping for.
GDP Revision the Big News for Next Week By the far the biggest news of next week will be the revision to the first-quarter GDP report. The first-quarter report was already relatively dismal with just a 0.2% annualized growth rate in the first quarter compared with 2.2% in December and 5% for the September quarter. Still, compared with last year's 2.1% first-quarter decline, maybe things aren't really so bad after all. Winters both years were unusually bad, though 2014 was slightly worse, weather-wise.
Unfortunately, based on subsequent data and some revised data, even that first estimate of first-quarter GDP for 2015 is likely to be way too optimistic. Our guess is that GDP will need to be reduced by 1% or even more, so technically the economy will have declined about 0.8%-1.0% instead of the 0.2% increase. In very rough terms, half of the revision will be due to sharply higher than BEA-estimated imports (apparently the Longshoremen on the West Coast worked a lot of overtime offloading ships that had been sitting in the harbors for months). The other half of the revision resulted from a smaller-than-estimated buildup of inventories, which isactually a very good thing for the economy in the months ahead. Slightly lower than originally estimated retail sales may also take an additional 0.1% off of the original growth estimate.
There is likely to be a lot of fretting next Friday about a down GDP print (combined with not exactly great news in April) and worries that we are moving into a recession. That is highly unlikely, given that weather played a role, as did the port strike, in the poor first-quarter performance. Unless the estimate is much lower than our estimated 1% decline in the first quarter, we will stick with our 2.0%-2.5% growth rate for the full year. That means that growth in the back three quarters of the year will have to average over 3%. Given what we are seeing in the housing industry, an improved government contribution, and a smaller net export problem, we believe this is entirely possible. That's especially true given the almost 5% growth rates we saw in the second and third quarters of last year.
Durable Goods: a Bottom at Hand
We have been griping about the manufacturing segment for almost a year and now believe that some of the worst of the declines may be over. Despite a consensus forecast for a decline in durable goods orders in April (0.5%), we believe headline orders will be in the black. Seasonally adjusted
New Home Sales Could Bounce We had two fantastic months of new home sales (over 500,000) before sales dropped off to a still healthy 481,000 units in March. Most economists agree that the March dip was a bit of a blip and sales should rebound to 500,000 or more units for April. We think the news could be even better.
/cloudfront-us-east-1.images.arcpublishing.com/morningstar/T5MECJUE65CADONYJ7GARN2A3E.jpeg)
/cloudfront-us-east-1.images.arcpublishing.com/morningstar/VUWQI723Q5E43P5QRTRHGLJ7TI.png)
/d10o6nnig0wrdw.cloudfront.net/04-22-2024/t_ffc6e675543a4913a5312be02f5c571a_name_file_960x540_1600_v4_.jpg)