
Scouring S&P 500 Sectors For Bargains
The energy sector looks to be the last pocket of value in a fairly priced market.
/s3.amazonaws.com/arc-authors/morningstar/a90ba90e-1da2-48a4-98bf-a476620dbff0.jpg)

As the S&P 500 continues to notch fresh all-time highs, investors'
. Stock market valuations look fair at best--and, in some corners, stretched. According to our equity analysts, the S&P 500 looks fairly valued at present, as indicated by our current price/fair value estimate for
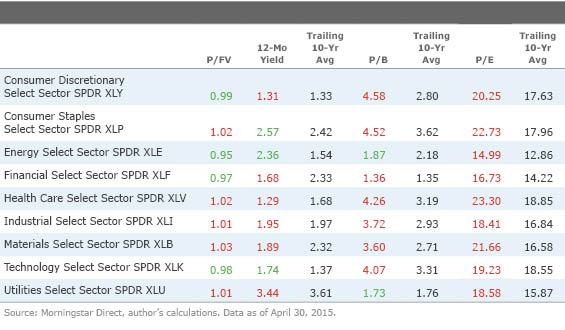
However, looking one layer deeper reveals a potential opportunity in the energy sector. In the table below, I've looked at valuations across each of the nine sectors of the S&P 500, as represented by the Select Sector SPDRs that track the relevant sector benchmarks. Based on this snapshot--which includes our analysts' fair value estimates and current and historical average yields, price/book value ratios, and price/earnings ratios--most sectors appear to be either fairly or modestly overvalued at present. However, the late-2014 downdraft in oil prices appears to have created a potential opportunity in the energy sector. Below, my colleague John Gabriel shines a spotlight on the largest and most-liquid ETF tracking the sector,
Suitability XLE can be used by investors as a tactical satellite holding to achieve broad exposure to the energy sector. The fund offers diverse exposure to the various industries that comprise the sector. Integrated oil and gas firms make up the largest portion of the portfolio at 32% of assets, followed by oil and gas exploration and production firms (29%), equipment and services companies (17%), storage and transportation firms (10%), refiners (10%), and coal and consumable fuels companies (1%). The fund represents an inexpensive and efficient way to invest in the U.S. energy sector without assuming too much idiosyncratic risk.
As a market-cap-weighted fund, the fund's portfolio is fairly top-heavy. Vertically integrated supermajors
Other segments of the oil patch, such as exploration and production, are much more sensitive to volatile energy prices. Investors should expect the underlying firms' reliance on energy prices to translate into higher volatility for XLE relative to the broader market. For example, the S&P 500 experienced a standard deviation of returns of 14.7% over the trailing 10 years. Over the same period, the standard deviation of returns for XLE was more than 22%. Geopolitical risks can be a key factor driving volatile energy prices. Current turmoil in the Middle East, speculation about production cuts (or lack thereof) by Saudi Arabia and other OPEC members, and surging shale oil volumes out of the United States have all contributed to recent energy price volatility.
Over the years, the diversification potential of XLE seems to have been eroding. Over the trailing 15-year period, XLE has been 64% correlated with the S&P 500. However, over the trailing 10- and five-year periods, its correlation to the S&P 500 has increased to 71% and 84%, respectively. Still, the fund remains an effective tool for investors seeking to have an overweighting to the energy sector within a broadly diversified portfolio. The energy sector currently makes up about 9% of the S&P 500. Keep in mind that as a U.S. sector fund, XLE does not offer exposure to international supermajors such as
Fundamental View Integrated oil and gas companies have operations that span the full energy value chain. These companies, which represent about 32% of XLE's assets, explore for and produce oil and gas, transport it, refine or process it, and sell it to end users. The integrated model has historically provided firms like Exxon Mobil and Chevron with competitive advantages. By integrating across the energy value chain, these firms are able to gain much tighter control over the production and sale of oil and gas, and they get to keep profits they would otherwise have paid out to middlemen in the form of economic rents.
In an attempt to secure long-term access to large-scale resources, the large integrated firms are competing for huge new projects and increasingly partnering with foreign national oil companies seeking to exploit government-owned resources. In a world of diminishing investable resources, securing such partnerships is important to help drive growth. This puts added emphasis on firms' technical expertise, ability to execute on time and budget, safety record, and cost of capital.
Exploration and production companies, which make up roughly 30% of XLE's portfolio, concentrate their efforts almost exclusively on exploring for, acquiring, and producing oil and natural gas. These firms face myriad risks, including commodity price volatility, exploration risks, operational risks, and political and regulatory scrutiny. Given the intense competition in this segment as well as the difficulty individual firms face in establishing competitive advantages, getting diversified exposure through an ETF like XLE may be appropriate for most investors.
Equipment and services firms, which represent approximately 17% of XLE's assets, provide the expertise necessary to improve oil and gas well economics and boost well productivity. The industry does serve U.S. independent oil and gas firms, but its largest customers tend to be the major international and government-owned oil companies. Demand for services in any given year tends to wax and wane, depending on customer expectations around commodity prices, particularly in North America, where contracts are usually very short.
The cyclical nature of the industry can obscure some of the positive long-term trends, which remain favorable. Oil, in particular, is becoming harder to find and extract. Global oil production has been stagnant since 2005, even after a trillion-dollar investment by the oil and gas industry. The number (and size) of oil discoveries made has been declining for decades. Oil-services firms' expertise is growing increasingly more valuable as the industry seeks to explore and extract oil from ever-more-challenging frontiers in new deep-water and even Arctic efforts. Large efforts are also under way to boost recovery rates from old fields.
Morningstar equity analysts use benchmark oil and gas prices based on Nymex futures contracts in their discounted cash flow models. If those forecasts prove incorrect, their fair value estimates will be off en masse. As of this writing, Morningstar equity analysts estimate that XLE is trading at a 6% discount to its aggregate fair value. Current geopolitical tensions and oversupply concerns could provide an attractive entry opportunity for long-term investors.
Portfolio Construction
This exchange-traded fund holds 41 oil and gas and energy-services companies included in the S&P 500. These firms make up the energy sector's entire 9% weighting in the S&P 500. The weightings of each stock roughly correspond to each stock's market cap. Thus Exxon Mobil, the largest oil company in the world, makes up roughly 15.5% of assets, and the top 10 holdings soak up more than 60%. Constituents are leading U.S. companies that meet S&P's profitability criteria. These criteria eliminate non-U.S. oil companies, including Shell,
Fees Select Sector SPDR ETFs are among the cheapest and most-liquid sector funds available. The fund's 0.16% expense ratio is low even by ETF standards. Moreover, its estimated holding cost of 0.11% means the fund has done an excellent job tightly tracking its benchmark. Note the difference between the fund's expense ratio and its estimated holding cost can be explained by the transaction costs associated with its replication strategy.
Alternatives
Two close alternatives for exposure to the domestic energy sector are
For exposure to the international energy space, investors may also consider
Disclosure: Morningstar, Inc.'s Investment Management division licenses indexes to financial institutions as the tracking indexes for investable products, such as exchange-traded funds, sponsored by the financial institution. The license fee for such use is paid by the sponsoring financial institution based mainly on the total assets of the investable product. Please click here for a list of investable products that track or have tracked a Morningstar index. Neither Morningstar, Inc. nor its investment management division markets, sells, or makes any representations regarding the advisability of investing in any investable product that tracks a Morningstar index.
/d10o6nnig0wrdw.cloudfront.net/04-18-2024/t_34ccafe52c7c46979f1073e515ef92d4_name_file_960x540_1600_v4_.jpg)
/d10o6nnig0wrdw.cloudfront.net/04-09-2024/t_e87d9a06e6904d6f97765a0784117913_name_file_960x540_1600_v4_.jpg)
/cloudfront-us-east-1.images.arcpublishing.com/morningstar/T2LGZCEHBZBJJPPKHO7Y4EEKSM.png)
:quality(80)/s3.amazonaws.com/arc-authors/morningstar/a90ba90e-1da2-48a4-98bf-a476620dbff0.jpg)