
Bond Portfolio Duration and the Flaw of Averages
While a fund’s duration is useful, investors need to understand where the bonds sit on the yield curve to understand its impact.

Interest-rate sensitivity, credit risk, and exposure to the yield curve are three of the biggest factors that have an impact on a bond's price. As a measure of interest-rate sensitivity, duration tells investors how sensitive a bond is to changes in interest rates. Theoretically, the longer a bond's duration, the more sensitive it is to changes in interest rates, and vice versa. In terms of credit risk, higher-quality bonds are generally more sensitive to changes in interest rates than lower-quality bonds.
The yield curve, in its simplest form, depicts yields at a point in time for U.S. Treasuries with differing maturities. In normal markets, as the time to maturity increases so would a bond's yield. This is intuitive because interest-rate risk tends to increase with maturity, and investors demand compensation for this risk. Investors' expectations of future short-term rates also influence the shape of the yield curve. If investors believe short-term rates will fall in the near term, the yield curve may become flat or even inverted--where long-term yields are lower than short-term yields.
A flattening or inverted yield curve is often interpreted as a sign that the economy is starting to cool and that the Fed may start to lower short-term rates. In contrast, a steepening yield curve usually points to a strong economy with increased inflation expectations. For the sake of the discussion below we'll focus on the relationship between a bond's yield curve exposure and its duration.
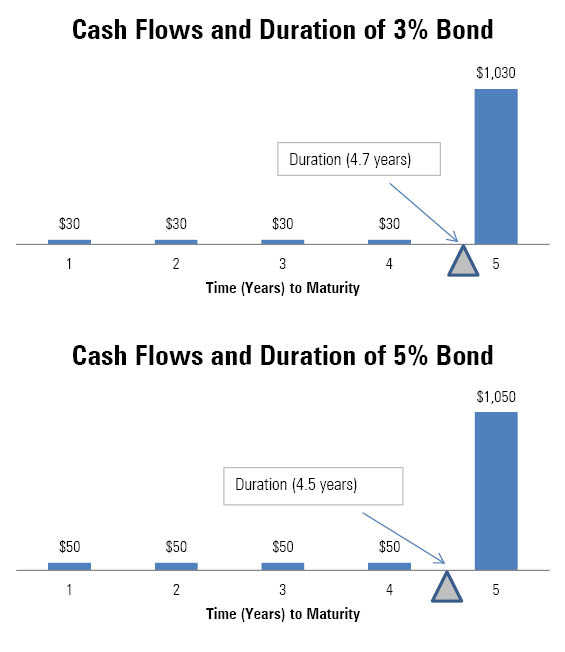
Duration Example At its root, duration is a function of a bond's time to maturity and coupon level. It helps tell investors how long it will take to get half of their original investment back. In the simplified example below, we characterize that original investment as the combination of a bond's coupon payments and an amortized portion of its par, or face, value. In reality, investors receive that par value when the bond matures, not over the time to maturity.
Nevertheless, take for example two corporate bonds with the same par value ($1,000), purchase price, and time until maturity (five years). However, one bond pays a 3% annual coupon, and the other pays a 5% coupon. The 3% coupon bond will have a longer duration (and be more sensitive to changes in rates) than the 5% coupon because investors collect their initial investment back more slowly. The charts below show the cash flows of each bond and its duration. For the sake of simplicity, we highlight the bonds' coupon payments only and then the final payment at maturity. As one can see, the 5% bond's duration is less than the 3% bond's. For the 3% bond, investors could expect to receive half of their original $1,000 investment back in 4.7 years. For the 5% bond, investors could expect to get half their investment back after 4.5 years.
In the example above, the two bonds would be affected by changes in the five-year Treasury rate, because they have the same maturity. The next chart shows the yield curve on March 31, 2014, and March 31, 2015.
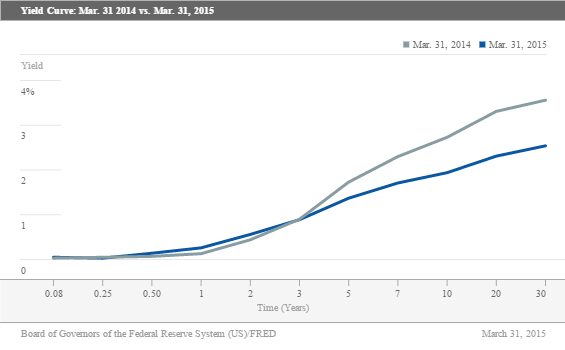
Over the trailing year through March 2015, the five-year yield fell to 1.37% from 1.73%. Theoretically, the longer-duration, 3% coupon bond would have benefited more than the 5% coupon bond from that drop in five-year yields (prices rise as yields fall). However, what might have happened had the two bonds had two years to maturity instead of five? The shorter-duration, 5% coupon bond would have outperformed, because the two-year Treasury yield actually increased to 0.56% on March 31, 2015, from 0.44% on March 31, 2014. Those rising yields reflected falling prices and would have had a less negative impact on the shorter-duration (5%) bond.
What this means is that for portfolios containing bonds with varying maturities, where those bonds land on the yield curve can have a bigger impact on the portfolio's overall performance than its duration in isolation. This is because bonds of different maturities sit on different parts of the yield curve and interest rates don't rise or fall in parallel across the entire yield curve.
Portfolio Level Duration Most fixed-income portfolios hold bonds of varying maturities, and conceptually one could calculate the portfolio's duration using an asset-weighted average of the bonds in the portfolio. Yet fixed-income managers use varying methods for calculating portfolio duration, and looking at one aggregate duration number will not entirely explain a bond fund's sensitivity to interest rates.
To highlight that challenge, we can work through a fairly straightforward example. As a starting point, consider the Barclays Intermediate US Treasury Index, which had an average duration of 3.80 years as of March 31, 2015. The index is a combination of Treasury bonds with maturities of one to three years (45% of index weight), three to five years (26%), five to seven years (18%), and seven to 10 years (11%). One can build a theoretical portfolio that matches the duration of the Intermediate Index by creating a barbell (or 50%/50% split) of the Barclays US Treasury 1-3 Year and Barclays US Treasury 5-7 Year subindexes. The chart below shows the final weightings as of March 31, 2015, with the barbelled portfolio in blue.
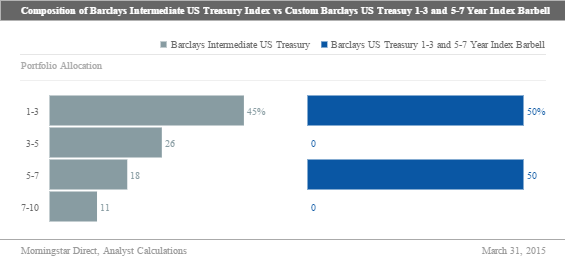
Despite having the same duration over the trailing year through March 2015, the custom "barbell" index generated 3.40% returns, while the Intermediate Index returned only 3.22%. This was because the custom index had an overweighting to the five- to seven-year part of the yield curve (where falling yields reflected rising prices) relative to the Intermediate US Treasury Index, while being roughly equal weight to the one- to three-year part of the yield curve (where rising yields reflected falling prices).
This is an important concept, because many managers apply barbell or yield curve strategies to their funds to shield investors from certain risks or to provide additional returns versus their benchmarks. For example, Baird Aggregate Bond BAGIX intends to match the duration of the Barclays US Aggregate Bond Index. However, they weight different parts of the yield curve to take advantage of yield curve steepening or flattening. The chart below shows that as of March 31, 2015, Baird Aggregate Bond was underweight in bonds in the one- to three-year maturity category (which saw prices fall and yields rise) and overweight in bonds with maturities greater than 10 years (which saw prices rise and yields decrease) relative to the Aggregate Index.
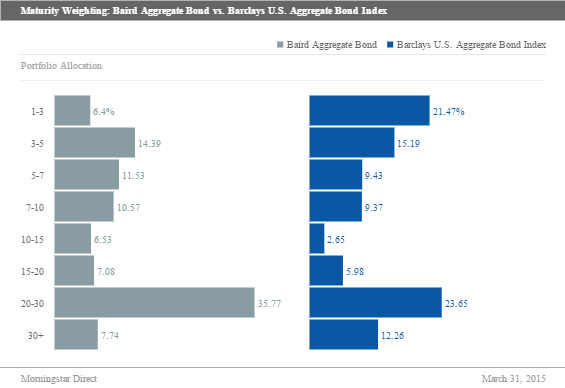
In part by taking advantage of different parts of the yield curve, Baird was able to generate returns (6.30%) above the Barclays US Aggregate Index (5.72%) over the trailing year through March 2015.
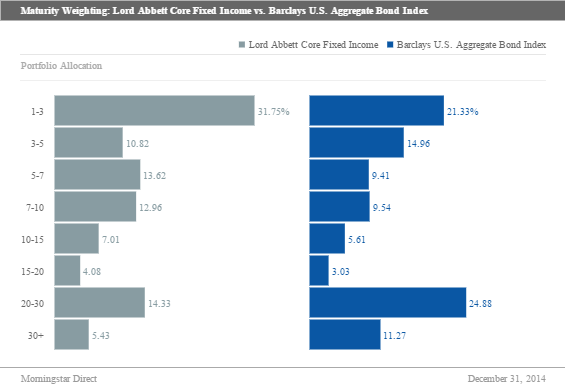
Investors should be aware that this strategy might not always work. For example, Lord Abbett Core Fixed Income LCRYX, which keeps a similar duration to the Aggregate Index, had an underweighting to long-duration securities and an overweighting to short-duration securities. This in part caused the fund's return (5.58%) to lag that of the Aggregate Index over the trailing year through March 2015. The chart below shows how Lord Abbett Core Fixed Income's holdings compared with those of the Aggregate Index.
Key Takeaways Average portfolio duration can be misleading. When comparing two funds with the same duration, a number of factors, including the funds' yield curve exposure, will affect the funds' performance. Understanding a fund's yield curve exposure can help investors better understand their fund's overall interest-rate risk. For investors looking to dive deeper into their bond fund portfolio, they can look at Morningstar.com's portfolio tab. In addition to seeing maturity range weights, investors can see historic interest- and credit-risk, coupon breakdowns, and sector breakdowns. Investors can also use different benchmarks to compare two fund's portfolio characteristics side by side.
Disclosure: Morningstar, Inc.'s Investment Management division licenses indexes to financial institutions as the tracking indexes for investable products, such as exchange-traded funds, sponsored by the financial institution. The license fee for such use is paid by the sponsoring financial institution based mainly on the total assets of the investable product. Please click here for a list of investable products that track or have tracked a Morningstar index. Neither Morningstar, Inc. nor its investment management division markets, sells, or makes any representations regarding the advisability of investing in any investable product that tracks a Morningstar index.
/d10o6nnig0wrdw.cloudfront.net/04-18-2024/t_34ccafe52c7c46979f1073e515ef92d4_name_file_960x540_1600_v4_.jpg)
/d10o6nnig0wrdw.cloudfront.net/04-09-2024/t_e87d9a06e6904d6f97765a0784117913_name_file_960x540_1600_v4_.jpg)
/cloudfront-us-east-1.images.arcpublishing.com/morningstar/T2LGZCEHBZBJJPPKHO7Y4EEKSM.png)