
Detecting Target-Date Series' Biases
A close inspection of sub-asset-class glide paths reveals notable divergences between target-date series.
/s3.amazonaws.com/arc-authors/morningstar/0c1d596a-78d2-477f-acfc-a1ff33479805.jpg)
Morningstar recently released its annual study of target-date funds. The Process section highlighted here delved into how examining target-date series' sub-asset-class glide paths helps investors understand target-date managers' varying investment approaches.
Digging Deeper Than the Equity Glide Path Target-date funds' equity glide paths map the predetermined asset-allocation course that investment managers plan to use over the course of investors' working years and beyond. They're useful in making broad comparisons between different target-date series, but they also only scratch the surface in identifying differences in target-date managers' approaches. In addition to the overall equity exposure, target-date managers also make decisions--some of which appear to be more deliberate than others--for multiple subasset classes.
Examining series' sub-asset-class glide paths sheds light on the fallout of managers' decisions. A closer look at the Vanguard Target Retirement series exemplifies the point. Vanguard's series invests exclusively in passively managed funds--seven in total--and thus is commonly classified as having a "passive" approach. However, Vanguard, like every target-date manager, makes active decisions in determining the overall and sub-asset-class mix across the glide path.
Exhibit 1 shows Vanguard Target Retirement's sub-asset-class glide path based on security-level holdings as of Dec. 31, 2014. (Vanguard subsequently announced strategic changes to its approach in February 2015, which will increase the series' international exposure in both its equity and fixed-income portfolios.) This glide path captures Vanguard's decision to inject Treasury Inflation-Protected Securities into the series approximately five years before a fund reaches its target date and to ramp up the allocation during an investor's retirement years. Exhibit 1 also indicates that Vanguard includes meaningful exposure to foreign bonds but omits high-yield bonds altogether. An investor would not spot these nuances looking solely at Vanguard's strategic equity glide path.
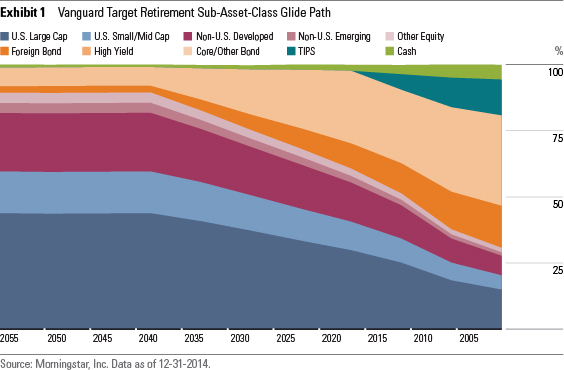
A shortcoming of Exhibit 1 is its inability to quickly identify when and how far a target-date series deviates from its peers. Exhibit 2 addresses this by plotting a line for each subasset class across the glide path. The y-axis indicates whether a series has a higher or lower stake in a given subasset class relative to the target-date industry average allocation. Observations above zero represent a relative overweight position, while observations below zero reveal an underweight position.
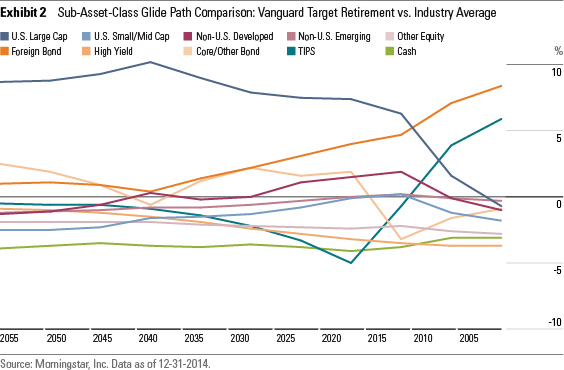
In the case of Vanguard Target Retirement, Exhibit 2 uncovers that the series has a relatively heavy stake in U.S. large-cap stocks--the 2040 fund's exposure tops the average by roughly 10 percentage points--leading up to the target date. That's a common bias among index-based strategies, as actively managed equity funds tend to give an underweighting to the market's largest-cap stocks.
It also shows that the series' foreign-bond exposure is higher than most, and that disparity increases for investors in their retirement years, topping out at approximately 8 percentage points above the average for the 2005 vintage. Vanguard's coming plans to increase the series' strategic allocation to foreign bonds will increase this relative position. Meanwhile, the series' TIPS exposure quickly moves from a narrow underweighting prior to the target date to an above-average stake in an investor's retirement years.
A Look Across the Board We calculated the degree to which 11 vintages for each of 48 target-date series deviated from the industry average across the 10 subasset classes as of Dec. 31, 2014. To facilitate the comparison, the target-date "Subasset Class +/- Average"--a new data point from Morningstar--averages the deviation for the 11 vintages to arrive at a single equal-weighted figure for each series, for each subasset class. This single figure does not capture instances when a series may deviate significantly at a certain point along the glide path, but it does provide a general view of series' relative biases.
Exhibit 3 shows the average relative position for each of the 48 series (ordered alphabetically) across the 10 subasset classes. Positive figures indicate an above-average position and negative figures reflect a below-average position. The above-average positions are displayed in varying shades of green and the below-average positions are shown in red (darker shades reflect a greater deviation from the average). For example, AllianceBernstein Retirement has a dark green value of 8 within non-U.S. developed equities, reflecting that the series, on average, has an approximately 8-percentage-point-higher stake in that subasset class than the typical peer.
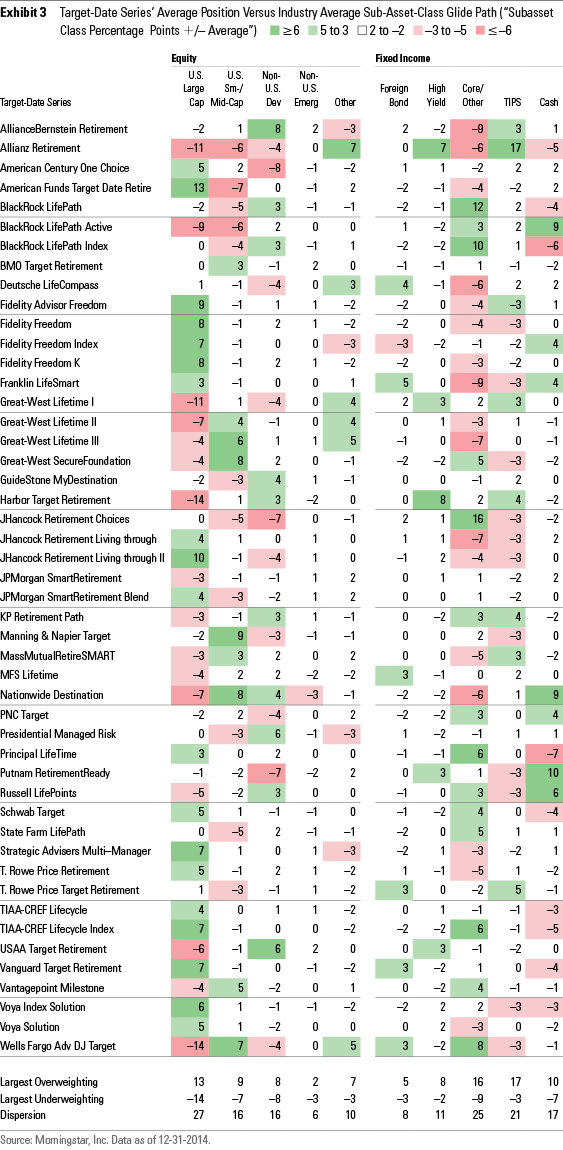
The data points in Exhibit 3 lead to three general conclusions concerning how target-date managers approach their series' construction.
1) Contrasting Views on Equity Exposure. Target-date series have a 27-percentage-point dispersion between series with the largest overweighting and largest underweighting in U.S. large-cap equities, the widest among the various subasset classes. The American Century One Choice series displays above-average positions in both U.S. large cap and U.S. small/mid-cap, but its non-U.S. developed exposure falls 8 percentage points below the norm, on average. American Century has announced plans to add to its non-U.S. developed exposure in early 2015, which may somewhat mitigate the series' home-country bias. Conversely, the AllianceBernstein Retirement series holds the highest average stake in the non-U.S. developed subasset class, but it remains near the norm in U.S. equity. This reflects that series' pronounced bias toward non-U.S. stocks within the overall equity allocation when compared with peers. Notably, the target-date industry's three largest series in terms of assets--Fidelity Freedom, T. Rowe Price Retirement, and Vanguard Target Retirement--hold relatively heavy stakes in the U.S. large-cap subasset class. (Vanguard's series can be expected to fall closer to the norm following its strategic changes in 2015.)
2) Using Their Strengths.
Multiple target-date series gravitate toward areas of strength within their respective firms. The Franklin LifeSmart series, for example, stands out with the highest average stake in the foreign-bond subasset class. That series has a sizable position in
3) Making Active Decisions. Even index-based target-date series can differ widely among one another. For instance, Vanguard Target Retirement and Wells Fargo Advantage Dow Jones Target both have heavy stakes in the foreign-bond subasset class--Vanguard's bias can be expected to be even more pronounced following the implementation of its strategic changes announced in February 2015--whereas BlackRock LifePath Index, Fidelity Freedom Index, TIAA-CREF Lifecycle Index, and Voya Index Solution do not even venture into that subasset class. Furthermore, Voya Index Solution is the only index-based series that has an above-average stake in the high-yield subasset class.
The Prize of Digging Deeper Identifying the key differences in sub-asset-class glide paths can help investors in a few ways, such as understanding the primary drivers of target-date series' past and future performance. For example, the American Funds Target Date Retirement series' large average relative exposure in U.S. large-caps went a long way to helping its funds achieve across-the-board top-quintile return ranks in 2014, a year when U.S. large-cap stocks outpaced most other stock subasset classes. Investors need to understand target-date series' various tilts to put performance in the proper context. This perspective also helps set expectations for future performance. For instance, investors shouldn't expect a series with a relatively light stake in U.S. equities, no matter the strength of the underlying strategies, to lead the pack should U.S. equities continue to deliver market-leading results.
Because no single glide path is inherently superior to all others, it's important to understand the driving forces behind target-date managers' glide-path decisions. Investors and their fiduciaries should know and agree with the approach that serves as a foundation for their target-date funds, and evaluating all levels of series' asset-class exposures can help in that assessment. Knowing those distinctions helps investors make better decisions, allowing them to see target-date series' longer-term potential among the shorter-term noise.
/cloudfront-us-east-1.images.arcpublishing.com/morningstar/ZKOY2ZAHLJVJJMCLXHIVFME56M.jpg)
/cloudfront-us-east-1.images.arcpublishing.com/morningstar/IGTBIPRO7NEEVJCDNBPNUYEKEY.png)
/cloudfront-us-east-1.images.arcpublishing.com/morningstar/HDPMMDGUA5CUHI254MRUHYEFWU.png)
:quality(80)/s3.amazonaws.com/arc-authors/morningstar/0c1d596a-78d2-477f-acfc-a1ff33479805.jpg)