
Economic Weakness: Is It Just the Weather?
Next week's data will provide some important clues.

Most developed equity markets performed in a narrow range of 1%-2% weekly price increases while emerging markets continued to soar, this week up by another 4%. Emerging markets are up about 8% over the past two weeks, as fears that the U.S. Federal Reserve would quickly raise rates greatly diminished after last week's soft employment report. More stimulus and easing measures out of China a couple of weeks ago continue to stimulate interest in China and other emerging markets.
The U.S. equity markets had two good days this week and nothing the rest of the week. Like emerging markets, U.S. stocks rallied sharply on Monday on the reduced possibility of a June rate increase. Then the market sat around until Friday when a potential spin-off of
There was no economic news to speak of this week. The one exception might be the Job Openings report, which suggested that last Friday's sharp fall in employment growth might have just been a statistical fluke. Openings, at 5.1 million positions, are higher than at any time dating back to 2001. But even that really didn't have much of an effect on markets. In addition, the Federal Open Market Committee minutes released on Wednesday drew nothing more than a yawn, which is exactly what they deserved. Until the data says the economy is getting stronger and inflation is moving up toward 2%, nothing is going to happen. However, when that does happen, the Fed probably won't wait around for long. That is why next week's economic data will prove to be so critical.
The markets seem deeply torn between camps that believe that the apparent recent economic weakness is weather and West Coast port-related and those that believe there are deep underlying problems. The bulls believe that it is just a matter of time until we get back to growth of 3% or more and the United States captures a substantially greater portion of the world economy. Others are equally as passionate in believing that there is something insidious going on and the world is about to fall back into the abyss. One reader last week was kind enough to forward a list of 19 reasons that the economy was in real trouble, including slowing growth rates and economic distress around the world. It was a legitimate list of issues, several of which are already being addressed and some not. I think the truth probably lies between these two extreme views of the world. Demographics and a slowing energy economy will have a more negative effect on growth than many bulls anticipate. On the other hand, some world central bank easing programs are just now really kicking in and are likely to bear fruit in the months ahead. Europe and China are not likely to continue deteriorating, at least in a straight line, from here.
Weather has been a real factor in measuring economic activity. There is no way any statistician can create monthly seasonal adjustment factors that make any sense. All statisticians can do is adjust for average conditions. Last year we had a massive, once-in-a-lifetime pop in the economy in spring and early summer as the United States came out of a record-setting winter. This year, we will all be watching March and April data to see if there is at least some bounce, although the weather was not nearly as extreme as it was in 2014. And even if one is right about a good or even a very good economy, potentially higher interest rates in the United States, labor scarcities, and a more competitive world market could pressure corporate earnings into even a very good world economy. In this uncertain environment it comes as no surprise that year-to-date equity prices are little changed.
Job Openings Still on the Rise (by Roland Czerniawski) The Job Openings and Labor Turnover Survey for February reported a new post-recession high of 5.1 million job openings. January registered 5.0 million new postings. The new hires component of the report pulled back just slightly to 4.9 million from 5.0 million reported a month ago. Quits were down, too, from 2.7 million in January to 2.6 in February. Nonetheless, the JOLTS report continues to paint the picture of the labor market we've seen since early 2014. Job openings continue to rise rapidly, while hiring struggles to keep up with a wide array of new job postings. The rate at which employees voluntarily quit their current jobs ticked up slightly in late 2014, but has not materially changed since. The two particularly robust industries that continue to drive the level of openings are professional and business services and health care. Those are also the industries where the ratio of unemployed workers and job openings is now close to 1, which indicates a tight jobs market. It might be more difficult to find skilled candidates, especially this far into the recovery. The JOLTS findings make us feel more comfortable with March's low payroll number because the timing and quantity of hiring can vary rather dramatically month to month. The high number of job openings tells us that the desire to hire lives on, although it's the employers who might begin to face more challenges now in finding their ideal candidates, especially without providing adequately higher pay.
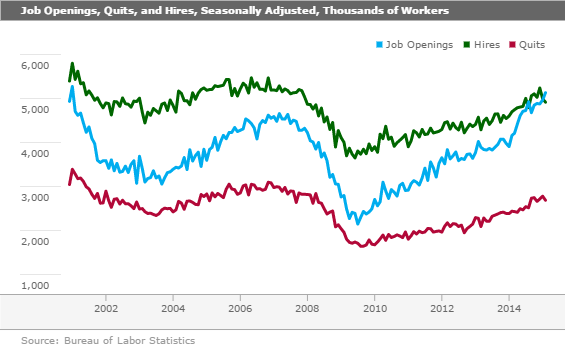
This is just another reminder that there are a lot of metrics besides the monthly employment report to judge the health of the labor market. For too long, the payroll growth rates looked abnormally high while a number of other employment indicators were good, but not great. Certainly the over 300,000 jobs added in November looked downright out of place. Job growth accelerated in a period when economic growth was slowing. Now with the much slower reported job growth in March and the substantial revisions to prior months, the employment data looks much more in line. However, the 126,000 jobs added in March is not the new normal, it was just an adjustment month. The strong JOLTS data (which is from the end of February versus the jobs report, which is from the second week of March) confirms that the job market is not falling apart. In fact, the huge number of openings suggests that employers will need to pay more or be more willing to train workers before the pace of hiring will increase. This might take some time. However, recent wage actions at
The Housing Market Remains a Puzzle as Home Price Growth Rebounds
Recent
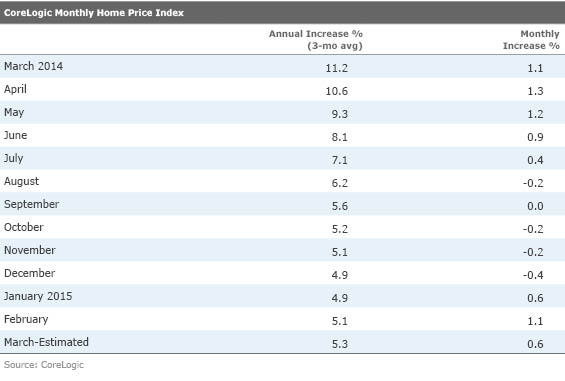
Prices at the Low End of the Market Are Accelerating Too Quickly One other interesting trend CoreLogic cited is that activity and prices in the lower end of the market have been much stronger than the high end of the market. Over the past year all prices are up 5.6%, but lower-end homes are up a more stunning 9.3% versus a tamer 4.8% for high-end homes. Hopefully, the higher prices will bring out more inventories. Unfortunately, the low end of the market is where there is the most interest and the demographics are more favorable. Higher prices at the low end of the market could quash improvements in housing activity. That is, unless the supply of homes increases either through more existing homes being listed for sale or builders offering more homes, especially attractively priced starter homes.
Cash Sales of Homes Falling but Still High One figure that continues to amaze us is that 39% of all home sales (new and used) are for cash (and not mortgaged) as of February. That's lower than the high of 46% in 2011 but still way above the 25% level that was present before the housing bust. CoreLogic estimates that if cash sales continue to fall at the current rate, it will still be until the middle of 2018 before the housing market returns to the more normal 25% level. High cash sales suggest a lot of investor activity and more limited first time buyer involvement.
Federal Budget Deficit Remains Under Control The budget deficit continues to worry many readers, but the news has been surprisingly good in recent years with the deficit shrinking from almost 10% of GDP to an anticipated 2.8% for fiscal year 2015. And the data shouldn't worsen much until 2020. That is, unless Congress undoes some of its spending controls. Data for the first half of fiscal 2015 suggests that the budget deficit will be the same or even modestly lower in 2015 compared with the deficit of $486 billion in 2014. The data released in March would seem to suggest that the deficit could fall as low as $400 billion-$450 billion compared with the official CBO estimate of $486 billion. Tax collections seem to be rising strongly at the same time interest on the government debt is declining. With the Fed now likely to push its rate increase to September, the lower rates may prevail for a bit longer than expected.
The data below suggests that the deficit is running a bit higher in 2015 than 2014. That increase is a bit of an artificial distortion. The deficit increase is entirely due to the fact that the onetime payments from Fannie Mae and Freddie Mac are now behind us. The lower Freddie and Fannie payments amounted to $46 billion while the deficit was up by just $18 billion during the first six months of the year. Through perverse government accounting rules, those payments are counted as reductions of expense rather than as revenue. So, lower collections in 2015 have meant expense increases look bigger than they would otherwise.
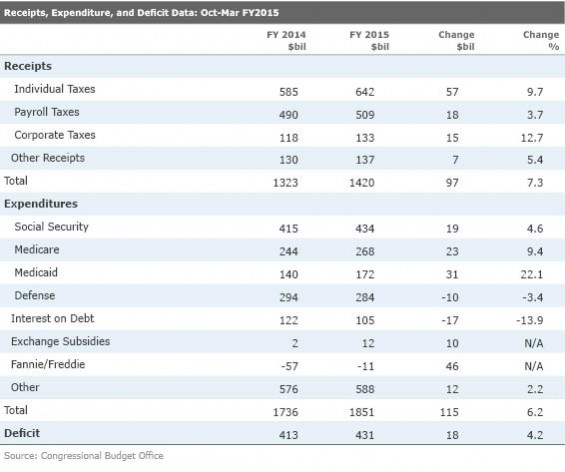
Federal government revenue is up an impressive 7.3% in the first half. Revenue is up because of strong employment growth and a progressive tax system. Meanwhile, expenses grew at a slower 6.2% (and an even slower 3.9% excluding the impact of reduced Fannie/Freddie payments). And most of the expense growth is in the Medicare program (aging boomers) and Medicaid (the Affordable Care Act). It's also interesting to note that expenses are fairly evenly spread throughout the year while tax collections are back-half loaded. Therefore, between now and Sept. 30, the deficit will not significantly worsen from its current level.
And while a half-year read on the deficit is valuable, the real key variable in forecasting the near-term deficit will be April individual tax collections. Because of the April 15 tax deadline, April is a huge month for individual tax collections. We will be watching closely when that data is released next month. Interest rates and inflation rates will be two other variables that could undo some of the recent deficit improvements, but it will take longer for deterioration in these metrics to show up in these reports.
Data Flood Next Week: Retail Sales, Housing Data, CPI, Industrial Production, and Small Business Sentiment on Deck A lot of recent economic data points have been confused by weather issues, blurring longer-term trends. The flood of March data to be released next week should provide some clarity as to whether the January and February problems were climate-related or if the economy's problems run deeper.
Big Bounce in Retail Sales Expected By far the most important report of the week will be the retail sales report. Consumers represent about 70% of U.S. economic activity. On a month-to-month basis, the previous three months have looked terrible, registering three consecutive months of declines. The headline shortfalls have come despite falling gasoline prices that were supposed to put more cash in consumers' pockets and boost retail sales. Weather (too warm in December, too snowy in February), may have played a role in those declines.
We think the impact of high utility bills and higher health insurance costs, as well as problems in energy-producing states have been underestimated. Nevertheless, the combination of a weather-related bounce and a large jump in auto sales is expected to drive March retail sales up a stunning 1.1% including autos and 0.6% if they are excluded.
Housing starts and permits will be critically important, too. With the manufacturing recovery showing signs of aging, we had hoped that the housing industry would pick up the slack. After a disappointing year for housing in 2014, hopes were high for a big rebound in 2015. However, 2015 got off to a rocky start with a big decline in housing starts, especially in February. However, some more recent housing data, including new home sales, pending sales of existing homes, and home prices, have all shown signs of life. Consensus hopes are high that housing starts will rebound from a dismal February showing of 0.90 million annualized units sold to 1.03 million units. We believe starts could do even better than that given strong permit data and improving weather conditions.
Consumer prices should be up again in March as gasoline prices continued their upward trend that began in February. Before February, overall prices were down for three consecutive months. On a month-to-month basis, total prices are expected to be up 0.3% in March, while year-over-year prices are likely to be unchanged. Some of the best inflation news of the year may already be behind us.
After a stellar year in 2014, the manufacturing industry has been losing steam as a stronger dollar hurts exports, auto sales grow at a respectable but slower pace, and oil-related production and production equipment begin to falter. None of this is particularly new. The consensus is forecasting a month-to-month decline in industrial production from a meager 0.1% in February to an outright decline of 0.2% in March. We believe the results could be even worse.
The National Federation of Independent Business (small-business) sentiment report is also due next week. We don't forecast this one, but it has been trending better for over a year (though the past two months were a little soft). We don't find the headline number terribly useful, but we always look at the wage and hiring plans as well as the number of hard-to-fill job openings. Those metrics have been particularly useful in gauging the health of the labor market and give us additional clues beyond what is in the government's monthly labor report. The last NFIB report suggested that the labor market was stronger than the government data suggested and that things were looking up for workers.
/cloudfront-us-east-1.images.arcpublishing.com/morningstar/MFL6LHZXFVFYFOAVQBMECBG6RM.png)
/cloudfront-us-east-1.images.arcpublishing.com/morningstar/HCVXKY35QNVZ4AHAWI2N4JWONA.png)
/cloudfront-us-east-1.images.arcpublishing.com/morningstar/EGA35LGTJFBVTDK3OCMQCHW7XQ.png)