
Not All Dividend ETFs Are Created Equal
The common dividend label belies what is a diverse array of equity-income strategies.
/s3.amazonaws.com/arc-authors/morningstar/a90ba90e-1da2-48a4-98bf-a476620dbff0.jpg)
Exchange-traded products, or ETPs, that are labeled with the "dividend-screened/weighted" attribute within our strategic-beta taxonomy represent the largest contingent of this universe as measured by assets under management. As of the end of February, these ETPs collectively held $134 billion of investors' assets. This represents 31% of the $434 billion in the broader strategic-beta grouping.
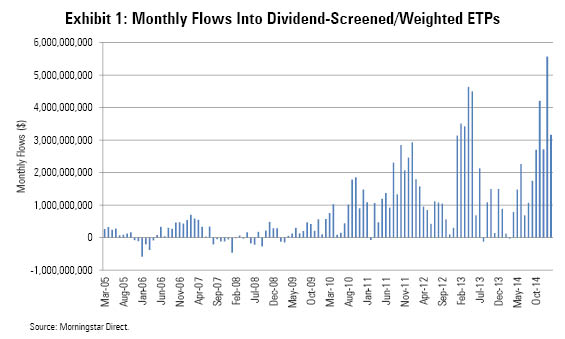
This category has been growing at a blistering pace in recent years. Over the trailing decade, dividend-oriented ETPs have attracted nearly $101 billion in new assets (see Exhibit 1 below).
This should come as little surprise in the context of the prevailing interest-rate regime and the secular uptrend in demand for sources of investment income as the first waves of baby boomers enter retirement.
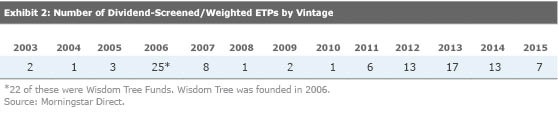
Asset managers have taken notice, and product proliferation is in full swing. Of the 99 dividend-screened/weighted ETPs that exist today, more than half are less than five years old (see Exhibit 2 below). As the menu of dividend-oriented ETPs expands, it is important that investors understand that not all dividend ETPs are created equal. Each has its own unique characteristics, which stem from important--albeit often nuanced--differences in the methodologies of their underlying benchmarks. Understanding three key characteristics of these funds (which all spring forth from differences in their benchmarks' construction) can help investors to make more informed choices. These three characteristics are: 1) dividend yield, 2) dividend growth, and 3) dividend sustainability.
Dividend Yield A fund's current dividend yield is often the first metric that investors seek out when shopping for equity-income opportunities. The 12-month-yield metric aggregates an ETP's distributions over the trailing 12-month period and then divides that figure by the fund's net asset value. While this metric is interesting, it is not very useful in isolation. This is because it lacks context.
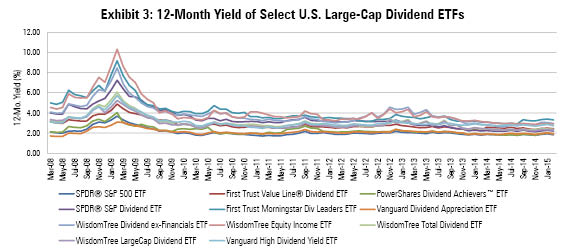
Framing a fund's 12-month yield in the context of its historical values and relative to the current and historical values for comparable strategies provides useful context. For example, in Exhibit 3 below I've plotted the monthly 12-month yields for those dividend exchange-traded funds that invest in U.S. large caps and whose inception was prior to 2007. I've also included
It is readily apparent, based on a passing glance at the exhibit below, that these funds' yields can be quite volatile over time. It's also obvious, most notably looking back to the 2008-09 bear market, that these funds' yields can diverge from one another in dramatic fashion. At the end of February 2008, the highest-yielding fund of the lot,
Source: Morningstar Direct
.
Dividend Growth Investors too often look at dividend yields in isolation, without giving dividend growth its due. Dividend growth is a vital component of the overall income equation, as it will determine the extent to which an investor's equity income stream will lag, keep pace with, or outstrip the rate of inflation. The goal, of course, is to grow this income stream at a rate that exceeds inflation, in order to grow one's real (that is, inflation-adjusted) income.
Of the 11 ETFs included in the sample above, five of them track a benchmark that specifically screens its investable universe for firms with long track records of paying and/or regularly increasing dividends.
Dividend Stability Perhaps even more important than dividend growth is the overall stability of a dividend-oriented ETP's income stream. After all, investors looking to these funds as a source of cash flow would be disappointed to find that their income stream is volatile, and may be devastated if they were to take a substantial pay cut.
The financial crisis provided a test case for these ETFs, putting the dividends of the stocks they owned under extreme pressure. For each of the funds in my sample, I've calculated what I'll refer to as their "maximum dividend drawdown." That is, the largest negative year-on-year decline in their annual dividend payment--which in every case took place in 2009. Interestingly, the five ETFs whose benchmarks specifically screen their constituents on the basis of a steady history of paying and growing dividends had, on average, relatively muted dividend drawdowns relative to their peers.
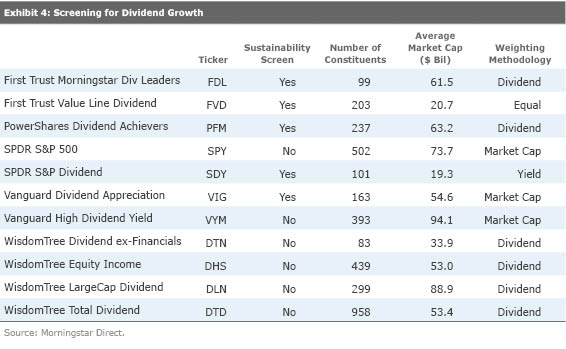
Putting It All Together In the table below I've put it all together. The ETFs included are the same as those referenced above. Once again, I've included dividend-screened/weighted ETFs that invest in U.S. large caps and whose inception was prior to 2007. I've also included SPDR S&P 500 ETF as a point of reference. In the table, I've included these funds' 12-month yield as of the end of February, the maximum year-on-year drawdown of their annual dividend, the trailing three- and five-year compounded annualized growth of their dividends, and their expense ratios.
The "Composite Score" in the far right-hand column is a simple sum with a maximum value of 5. If an ETF has an above-average current yield, a below-average maximum dividend drawdown, above-average dividend growth over the trailing three- and/or five-year periods, or a below-average fee, it earns a point. I've ranked the ETFs in this group in descending order on the basis of their composite score.
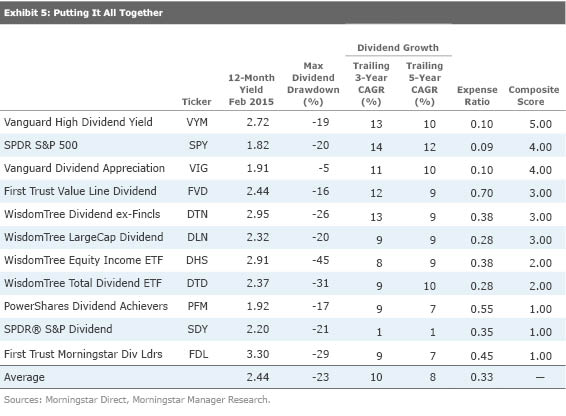
The ranking above gives a back-of-the-envelope assessment of the recent historical performance of the current crop of dividend-oriented ETPs. It is not meant to be a comprehensive list best-of-breed funds--especially as it excludes a dozen newer entrants that also dabble in U.S. large caps. What it does provide, however, is a useful guide for investors in conducting their own due diligence. Specifically, investors mulling an allocation to a dividend ETP should consider the following:
1) Price. Fees are the most stable, explicit, and predictable detractor from future performance and will come directly off the top of an investor's income stream. Look for low-cost funds.
2) Yield. But do not consider yield in isolation. Rather consider it in its historical context, how its stacks up relative to peers, and how it springs forth from the underlying index methodology.
3) Growth. Look for funds that can grow their dividends at an inflation-plus rate over the long haul. Benchmarks that specifically screen on the basis of historical and/or prospective growth should have better odds of growing their income streams over time.
4) Stability. Investors should place a premium on income stability, particularly in bear markets. On average, the ETPs in the sample I studied that are based on benchmarks that specifically screen their investable universe for growing and/or stable dividends fared better during the financial crisis, experiencing relatively muted dividend drawdowns versus their peers.
Disclosure: Morningstar, Inc.'s Investment Management division licenses indexes to financial institutions as the tracking indexes for investable products, such as exchange-traded funds, sponsored by the financial institution. The license fee for such use is paid by the sponsoring financial institution based mainly on the total assets of the investable product. Please click here for a list of investable products that track or have tracked a Morningstar index. Neither Morningstar, Inc. nor its investment management division markets, sells, or makes any representations regarding the advisability of investing in any investable product that tracks a Morningstar index.
/cloudfront-us-east-1.images.arcpublishing.com/morningstar/24UPFK5OBNANLM2B55TIWIK2S4.png)
/cloudfront-us-east-1.images.arcpublishing.com/morningstar/T2LGZCEHBZBJJPPKHO7Y4EEKSM.png)
/d10o6nnig0wrdw.cloudfront.net/04-18-2024/t_34ccafe52c7c46979f1073e515ef92d4_name_file_960x540_1600_v4_.jpg)
:quality(80)/s3.amazonaws.com/arc-authors/morningstar/a90ba90e-1da2-48a4-98bf-a476620dbff0.jpg)