
The Big, Bad Bite of Taxes and Inflation
Both factors dramatically cut historical stock and bond returns, stressing the importance of tax-advantaged accounts and inflation-beating strategies.
The Big, Bad Bite of Taxes and Inflation
Both factors dramatically cut historical stock and bond returns, stressing the importance of tax-advantaged accounts and inflation-beating strategies.

Tim Strauts: Today, we are going to look at how stocks and bonds have performed historically before taxes, then after taxes, and finally after taxes and inflation. Before we get to the charts, here is how we calculated aftertax returns. Federal income tax is calculated using the historical marginal and capital gains tax rates for a single taxpayer earning $110,000 in 2010 dollars. This annual income is adjusted using the Consumer Price Index in order to obtain the corresponding income level for each year. Income is taxed at the appropriate federal income tax rate as it occurs. When realized, capital gains are calculated assuming the appropriate capital gains rates. The holding period for capital gains tax calculation is assumed to be five years for stocks, while government bonds are held until replaced in the index. No state income taxes are included.
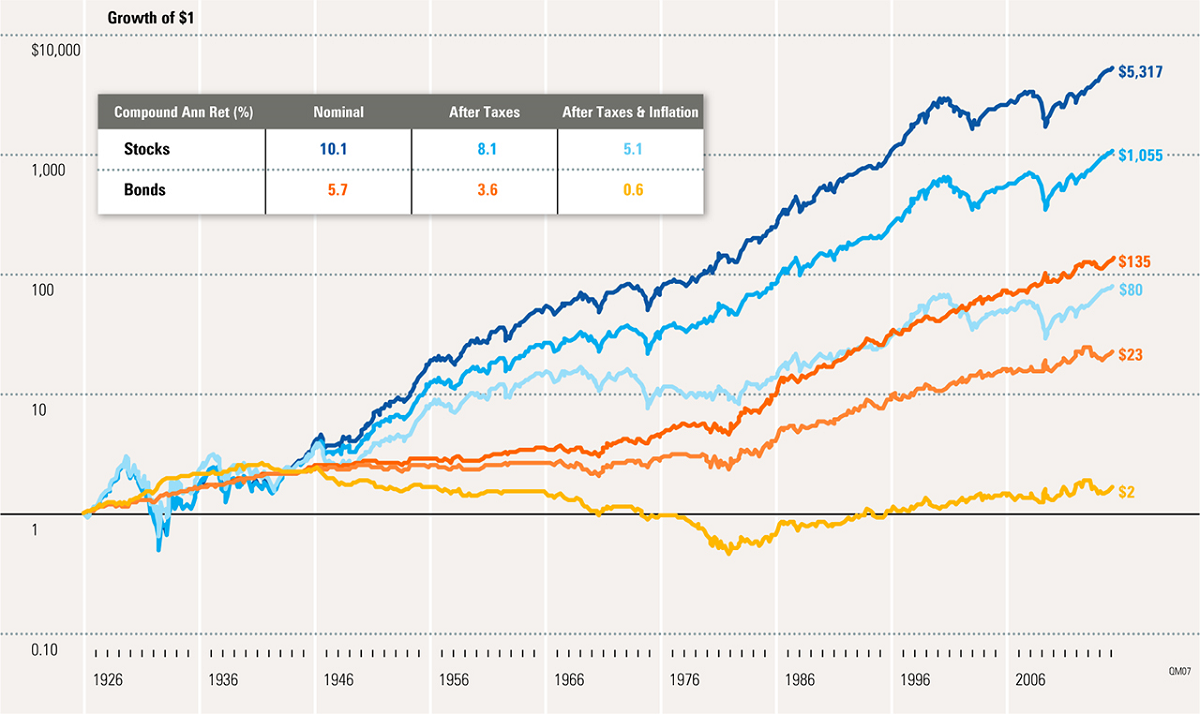
In the first chart, you can see that stocks have returned an annualized 10.1%. One dollar invested in 1926 grew to $5,317. Government bonds returned 5.7% annualized, and a dollar grew to $135. In the next chart, we are looking at aftertax returns. Stocks only return 8.1% annualized, and a dollar only grows to $1,054. With 2% lower annual returns, your ending wealth is 80% lower after taxes. Government bonds only return 3.6%, and a dollar only grows to $22.74. The last chart looks at returns after taxes and inflation. Now, stocks only return 5.1%, and a dollar only grows to $80.39. Bonds only return 0.6%, and a dollar only grows to $1.73.
This series of charts shows that investors need to pay attention to taxes and be cognizant of the effects of inflation. Investors should choose investment strategies that reduce these effects, like taking advantage of retirement accounts with tax-deferred growth or holding investments longer than the five-year period used in this analysis.