
The Bad News Bulls
Investors are hoping bad economic news will delay a Fed rate hike, but their focus is misplaced.

World equity and commodities markets continued to be both volatile and downward trending this week, while bonds looked stronger on weak economic data. Commodities took the worst of the shellacking, down over 3%, probably as a result of a strong dollar and a continuing oversupply of oil. Emerging markets weren't so hot either, down well over 2% as worries about a stronger dollar continued to scare those markets. Talk of parity--a 1/1 ratio between the U.S. dollar and the euro is now frequently turning up in economists' forecasts for as soon as this fall. Early in the week it looked like traders were going to try to get us there even quicker with the euro getting as low as 1.05. It's hard to believe that we were over 1.4 euros to the dollar just a year ago. Unfortunately, my son chose to go to Europe to study last year and not this year.
European and U.S. markets were more (and incorrectly) focused on the Fed this week. We are back in that upside-down world that I so passionately despise. Good U.S. economic news, like last week's employment report, throws the markets into meaningful tailspin. Meanwhile, poor data, such as the retail sales report for February (showing yet another month-to-month decline) caused the market to spike. Why? The better the economy, the sooner the Fed is perceived to have to raise rates. And markets fear a rise in rates like the plague.
Personally, we think the market is spending way too much time on the "when" part of the rates question and not nearly enough on the "how much, how long, and in what increments" issues. A favorably received delay in the Fed rate increase only means that future increases will be larger or subsequent rate increases will be spaced closer together if the first increase is delayed--that is, if the U.S. economy is as strong as I perceive. While weather is distorting a bunch of economic data in the short run, the U.S. economy is fine shape. Perhaps not quite as good as some of the more bullish forecasters are (or were) projecting, but certainly not enough to deter the Fed from raising rates and ending some of its emergency programs sometime in 2015.
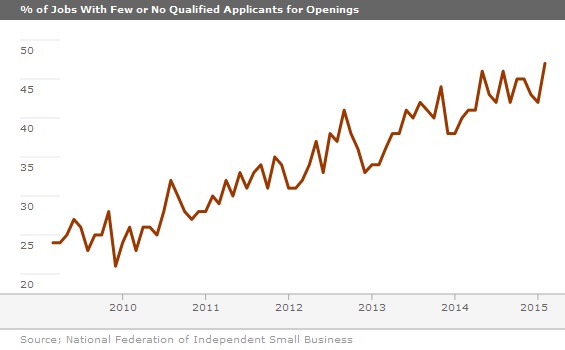
In other economic news this week, there was more support for our thesis that labor scarcities will continue to develop and that wage rates are likely to increase. First, the Job Openings and Labor Turnover Survey (JOLTS), released this week showed even more openings for January. This came even in the face of accelerating job growth. One might suspect that openings would at least temporarily go down during such times, as positions are filled. The openings are very near an all-time high (well, that is, only from 2001, and there is only one higher reading than this one). In addition, the subsections of the small-business sentiment report from the National Federation of Independent Business showed more companies were finding positions hard to fill, and plans to boost worker pay continued.
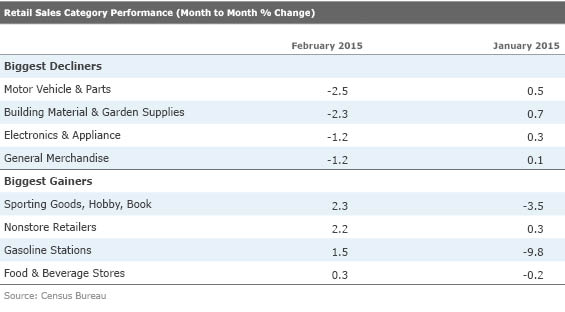
As Predicted, the Retail Sales Report Was Disappointing, but No Need to Worry Perhaps because of generally falling gasoline, economists were way too optimistic about the month-to-month retail sales report, expecting retail sales to grow 0.3%-0.5% for February. We warned last week that this appeared to be overly bullish in light of very bad weather conditions, poor weekly chain store reports covering the same period, and the already-known disappointment in auto sales. That said, even we were surprised to see retail sales fall a stunning 0.6% between January and February. This marked the third month in a row of flat or down retail sales. Weather was surely a factor, as shoppers, particularly in the Northeast, were unable to get to the store to make purchases.
The retail sector data was just as terrible. The only categories showing any growth were groceries (as people stocked up for the storms, and couldn't make it to restaurants), gasoline (only because of higher prices, gasoline prices were up a lot in February), hobbies and books (stuck at home), and online shopping (since consumers couldn't make it outside to shop, they needed to get their shopping fix somewhere). Every other sector was down: restaurants, cars, apparel, building materials, lawn and garden equipment, and this list goes on.
Worth mentioning is that restaurant sales hit a brick wall in February with sales falling 0.6% month to month and a sharp downwardly revised figure for January (now down 0.2% instead of being up). In last month's analysis of the retail sales report, we commented that restaurant sales growth often seems to peak at around 8% on a year-over-year basis and that some type of correction might be in the works. We just didn't expect to the correction quite this soon.
Even to us, the retail sales data remains at least a little puzzling. Generally very low, but if trending up, gasoline prices and surging incomes should have meant at least a modestly improving retail environment, even on a month-to-month basis. Looking more broadly at consumption data, income growth is surging while consumption is relatively stagnant. The harder-to-collect consumption data for February, which includes services, is also likely to be terrible, too, when it is reported at the end of the month. Given the employment report, incomes are likely to surge again in February, widening the gap between income growth and consumption.
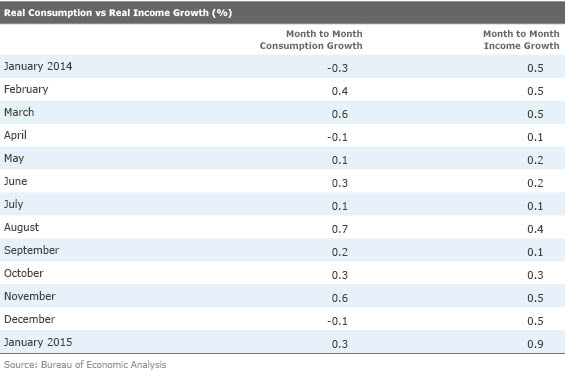
Saving Rate Soars; Dry Powder for Spring Spending That income/consumption gap manifests itself in shockingly high growth in the savings rate.
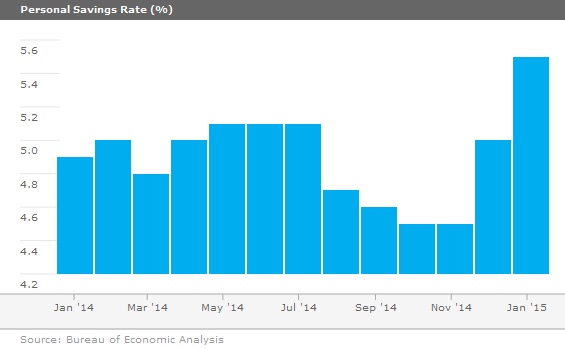
We joke that U.S. consumers always manage to spend just about every dollar they make, so we believe it is just a matter of time until consumption and retail sales figures begin to break out. We saw that same buildup in the savings rate late last spring and summer, which caused a massive surge in retail sales in the fall. We think a similar pattern will recur this year. Based on the retail sales report, the savings report will surge even higher in February. The shopping center report for the first week of March was still in the doldrums, but unusually warm weather and an early Easter (in March) should help the retail situation later in the month and for the month as a whole. If the retail surge doesn't come in March, it should certainly begin to show up in April or May.
We have theories about the low spending rates currently, but they are just that for now: theories. Sky-high utility bills from high usage, even as prices are low, could be hurting consumer spending at conventional outlets. And it seems that we have all become weather wimps lately, saving shopping for nice days, as indicated by the surge in groceries and in sales from
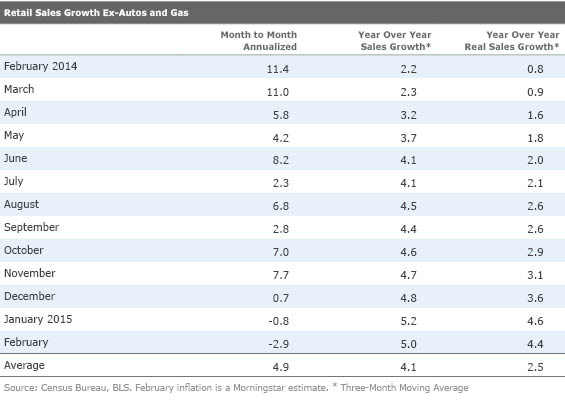
Enough of the Doom and Gloom: Year-Over-Year Retail Sales Data Looks Safe for Now Normally we would lead with the strong year-over-year, averaged data for retail sales, but truly horrendous weather last year makes the data look just a little too good. The year-over-year data could hit a snag over the next couple of months, a period when sales surged a year ago. Still, the data still looks pretty darn strong to me, and with higher incomes coming into play, it seems just a matter of time until the month-to-month data begins to track to the higher year-over-year data. The data below excludes autos and gasoline.
Short-Term Budget Deficits Moved Modestly Higher, Intermediate Term Revised Meaningfully Lower The Congressional Budget Office recently released actual budget data for the first five months of fiscal 2015, new full-year 2015 estimates, and revised figures for the next 10 years. The five-month data largely reflected trends we had already seen, decent growth in tax revenue combined with large growth in Medicare, Medicaid, and Social Security producing little change in the overall deficit. Defense spending and interest payments remained on the down side, and every other category was basically flat, while payments/adjustments from the major mortgage entities were down sharply from a year ago. Year over year the combined deficit was little changed and is forecast to show very little change in 2015 compared with 2014.
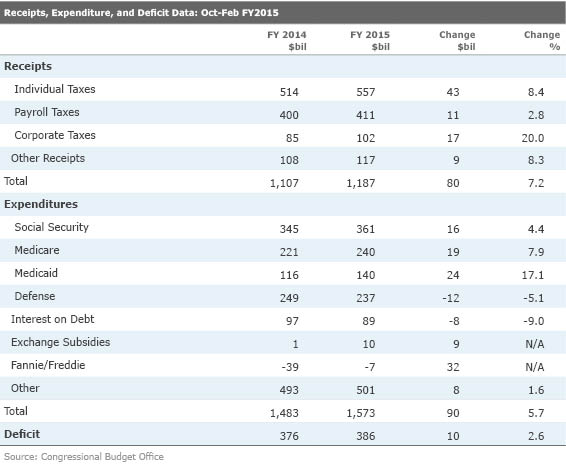
There was some hope for a modestly larger improvement in the 2015 deficit, but the student loan program and Medicaid programs both showed larger-than-expected increases. The deficit is now expected to remain steady in 2015 at $468 billion rather than decline by about $20 billion.
As a percentage of GDP the deficit for 2015 is now projected to go down from 2.8% of GDP to 2.7% because of a higher GDP estimate for 2015 compared with 2014. That compares with a peak deficit of 9.8% in 2009 at the bottom of the recession and the average since 1965 of 2.7%.
Despite a slightly higher deficit estimate for 2015, the deficit for the remaining 10 years of the forecast period are being reduced by about $431 billion, or 7% in very, very round numbers. Lower health-care expenditures and higher taxable wage estimates are behind the surprisingly large improvement in the deficit situation. The deficit is now not expected to hit 3% again until 2020 and will not get as high as 4% for the whole 10-year forecast period. Just a month ago, the CBO deficit was forecast to hit 3% in 2019 and 4% in 2025 (versus 3.7% in the brand-new forecast).
Consumers Cautiously Add More Debt, Businesses Expand Debt and Cash Once a quarter, the Fed releases data on consumer, business, and government balance sheets in the quarterly Z.1 report.
The report indicated that businesses were relatively aggressive in adding new debt during the fourth quarter, expanding debt by 7.2%, its fastest growth rate since 2008, just before the recession really hit its stride. Given a stronger economy and dirt-cheap interest rates, the expansion of corporate debt is not at all surprising or alarming. That is especially true as businesses also expanded their cash balances to a new all-time high of $2.0 trillion, an increase from $1.89 billion in the third quarter. So, some of the corporate borrowing appears to be merely opportunistic, with additional debt proceeds being largely held in cash and not being used for expansion.
Consumers were more cautious with debt expansion of 2.7% in the fourth quarter. At least consumers have finally felt secure enough to begin borrowing more over the past year, after several years of mortgage-driven drops in consumer debt. Still, with incomes accelerating, debt as a percentage of disposable income continued to drop and now stands at 102% of income, down from 130% in 2007. That is still higher than the 60%-65% rate that typified the mid-20th Century. However, today's lower interest rates, if they can be sustained, suggest that consumers can support a higher level of debt than in the past century.
JOLTS Shows the Appetite for New Hires Is Still Large and Growing (written by Roland Czerniawski) The Job Openings and Labor Turnover Survey showed that there were 5.0 million openings in January, the highest level in 14 years. The level of new hires declined to 5.0 million from 5.2 million in December. The level of quits stayed unchanged.
The data shows that new openings continue to be a very strong aspect of the labor market, and despite the rapid acceleration in the payroll data, the number of openings remains high. Quits, which are voluntary, are typically a decent representation of workers' confidence and improving labor market conditions, and that figure has been gradually improving, but not nearly as fast as the other two metrics.
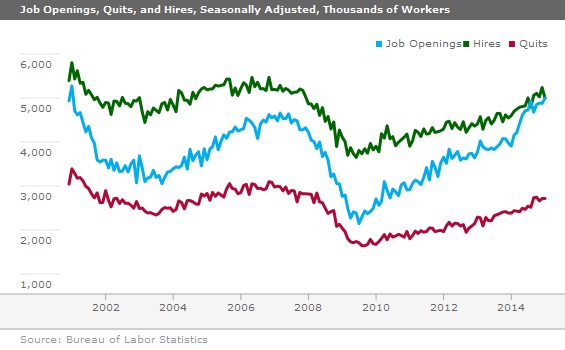
The strength of new openings is one of a few indicators suggesting that U.S. employers will continue to hire more workers, and a high number of newly posted positions should eventually get filled. Nonetheless, the strong nature of various labor market indicators lately is somewhat puzzling, considering that both manufacturing and consumption have been a little sluggish over the past months. On the other hand, this could mean that after the period of rapid economic growth and improved earnings in the second half of 2014, many companies are now stepping up and filling pent-up demand for labor resources. Diminishing productivity gains that we have been observing over the past few years probably also make companies more likely to hire more now, especially in the services space. In addition, it is possible that the budgets for many of those positions have been approved last year, and in many cases the current slowdown will do very little to reverse those plans. This 2014 spillover theory, coupled with the fact that it has become increasingly more difficult to find skilled workers in the current stage of the business cycle (further elongating the hiring process), might explain the unusual strength of the jobs market that we currently see.
Small Businesses Show Difficulties in Filling Open Positions (written by Roland Czerniawski) NFIB's Small Business Optimism Index edged slightly higher to 98.0 in February, from January's 97.9 level. We are not big fans of this report in general. Like many sentiment-based reports, it has recently become a more concurrent reflection on the state of the economy rather than a leading indicator. The sections on hard-to-fill jobs and planned raises, however, are of value to us because they can provide a glimpse into the small-business labor market dynamics.
Both of those metrics have been moving up recently, and this trend continued in February. The hard-to-fill positions index increased all the way to 47, from the previous month's reading of 42. The compensation plans index increased month to month as well, recording a reading of 14.
Regardless of the monthly increases, the trend is clear. It is becoming harder for small businesses (and for bigger players, too) to fill open positions, and as a result plans to raise compensation are now in place. This speaks more broadly to the issue of labor market scarcity that has already hit certain industries, and we expect that labor shortages will become a more prominent theme in the future years.
Oh, Joy: More Winter Stunted Housing Data, Fed Navel-Gazing, and Mediocre Manufacturing Data Due Housing data was in a funk for most of 2014, and 2015 has started with just a whimper for the January data. With February weather even worse than January and prices on the rise again, it's hard to be optimistic about short-term housing data. Economists are projecting that housing starts will fall from 1.065 million in January to 1.045 million annualized units for February based on sluggish permit data and poor weather. Some of the construction employment data suggest the possibility that maybe some of the housing data will look a little better. In any case, I think 2015 will be a good year for housing, but tough weather conditions make this prediction hard to discern until late spring or early summer. This partially explains that while starts are expected to be lackluster, builder sentiment is expected to tick up from 55 to 57 as builders look ahead to those summer months. When the Fed eventually raises rates, we will be extremely curious to see if buyers who are sitting on the fence suddenly swing into action, as they did in 2013 when the taper tantrum drove both mortgage rates and home sales sharply higher. It's the opposite of what Economics 101 would teach, but with rates so low, it will take the scare of higher rates to drive recalcitrant buyers back into the market.
Speaking of the Federal Reserve Board of Governors, it meets again next week. Few are expecting a rate increase this month (although anything could happen). However, everyone is expecting some type of wording change that would give the Fed the room it needs to raise rates in June or September. While everyone seems fixated on the date of the first raise, I am a bit more worried about by how much, and for how long, it will raise rates. Over the previous four rate raises, the Fed has, over multiyear periods, raised rates by over 3%, and Wall Street has consistently underestimated the size of those increases, according to a St. Louis Fed economist. I have been in the modest-raise camp for some time. Nevertheless, I am increasingly worried that a combination of higher wage rates, an end to the commodity glut over the next couple years, and a move to an economy operating at near theoretical capacity by 2017 will drive inflation higher, necessitating a larger rate increase than many of us are now anticipating.
Manufacturing has been slowing for some time on softening energy demands and export sales. The consensus is for industrial production to finally move back up a little to a 0.3% gain for February. Again, the West Coast port strike and weather will modestly affect the February data, perhaps in unpredictable ways. Cold weather could help the top-line IP number through increased energy demands but reduce the manufacturing component. And, of course, the energy component won't look so hot, either. Therefore, we think the overall consensus figure of 0.3% growth looks too high.
/cloudfront-us-east-1.images.arcpublishing.com/morningstar/MFL6LHZXFVFYFOAVQBMECBG6RM.png)
/cloudfront-us-east-1.images.arcpublishing.com/morningstar/HCVXKY35QNVZ4AHAWI2N4JWONA.png)
/cloudfront-us-east-1.images.arcpublishing.com/morningstar/EGA35LGTJFBVTDK3OCMQCHW7XQ.png)