
A More Inclusive U.S. Aggregate Bond Index
A look at the Barclays U.S. Aggregate Bond Index's parent: Barclays U.S. Universal Bond Index.

Back when the Barclays U.S. Aggregate Bond Index (formerly the Lehman Aggregate Bond Index) launched in 1976, it was the first of its kind. It provided aggregate exposure to the U.S. bond market and gave bond managers an index by which to benchmark their performance. While it has become the most benchmarked and referenced bond index in the world, its name began to mean less "aggregate bond" and more "aggregate investment-grade bond" as time passed.
Part of that evolution stemmed from the emergence or expansion of newer opportunity sets within the fixed-income market. For example, the 1980s and 1990s witnessed the growth of the high-yield bond market. The 2000s saw innovation and growth in the asset-backed and nonagency mortgage-backed securities markets. As the fixed-income industry grew and market dynamics changed, the Barclays U.S. Aggregate Bond Index began to cover less and less of the U.S. fixed-income market, instead choosing to follow the same rules it had in place when it first launched. Today, the index excludes more than 16% of the investable, taxable, fixed-rate U.S. bond market.
But Barclays does offer a more representative market proxy in the Barclays U.S. Universal Bond Index--essentially the parent to the Barclays U.S. Aggregate Bond Index. Incepted in January 1990, it targets a wider range of investable, taxable, fixed-rate U.S. bonds. In addition to including all of the constituents of the Aggregate Index, the Universal Index includes high-yield corporate bonds, as well as eurodollar, emerging-markets (U.S. dollar and U.S. listed), 144A securities, and a broader swath of commercial mortgage-backed bonds excluded from the Aggregate Index. However, like the Aggregate Index, the Universal Index excludes tax-exempt municipal bonds and inflation-protected securities; this is generally done for tax purposes.
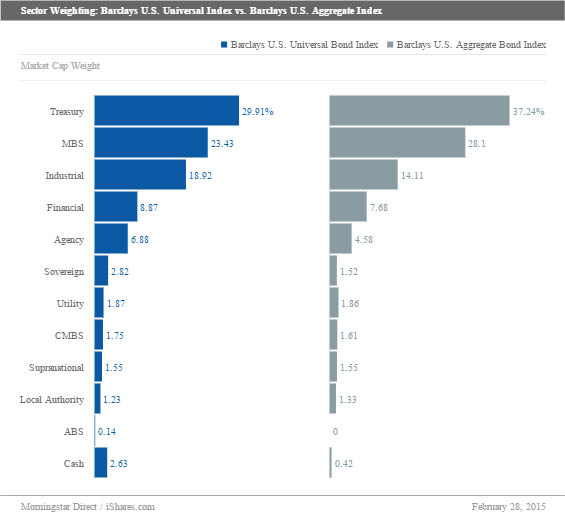
When the Barclays U.S. Universal Bond Index first launched, 98% of its market cap was represented by the Barclays U.S. Aggregate Bond Index with the remaining 2% allocated to the high-yield corporate bond market. As of Jan. 31, 2015, the market-cap percentage of the Aggregate Index within the Universal Index had fallen to 84%. High-yield corporate bonds represent 6%, with the remainder allocated to the other additional bond sectors. The chart below shows how each of the different bond sectors are weighted in each index. Both indexes have large market-cap weightings in U.S. Treasuries and agency MBS, but the Universal Index is better able to spread its weight across sectors under-represented in the Aggregate Index, such as corporate (industrial and financial), agency, and sovereign bonds.
A Stronger Long-Term Risk/Reward Profile The addition of higher-yielding assets, such as high-yield corporate bonds, not only makes the Universal Index more representative of the investable, taxable, fixed-rate U.S. bond market, but also helps increase its yield relative to the Aggregate Index. For example, as of Jan. 31, 2015, the Universal Index's yield to maturity (2.5%) exceeded that of the Aggregate Index (1.9%). Over the trailing 15 years through January 2015, the average yield to maturity difference between the two indexes was 0.4%, despite having nearly identical duration over the same time period.
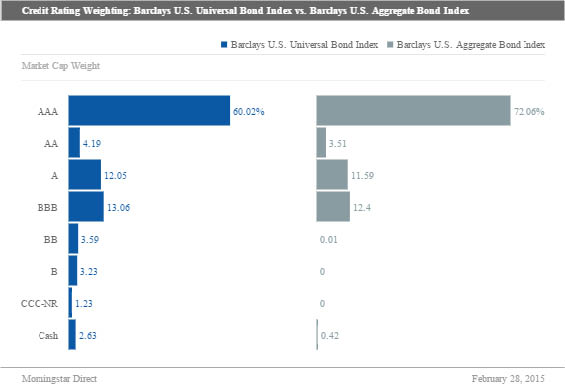
While the Universal Index holds lower-credit-quality bonds than the Aggregate Index, its market-cap weighting ensures that those bonds are not overweighted. For example, only 8% of the Universal Index's market cap comprises bonds with below-investment-grade credit ratings. Additionally, more than 60% of the index's market cap is in bonds rated AAA (versus the Aggregate Index's 72%). This helps keep the Universal Index's average credit rating (A) investment-grade and only slightly below that of the Aggregate Index (AA).
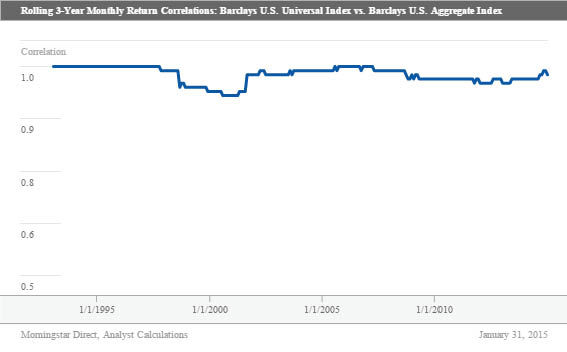
While higher-yielding bonds have historically exhibited low correlation to the Aggregate Index, the Universal Index's high-quality exposure keeps it highly correlated to the Aggregate Index. This can allow one to get an investment experience similar to that of the Aggregate Index with increased yield. For example, since inception, the Universal Index's rolling three-year monthly returns had an average correlation of 0.98 to the Aggregate Index's. Additionally, the correlation between the two indexes' trailing three-year monthly returns has never been below 0.93. The chart below shows the correlation between the trailing three-year monthly returns of both indexes.
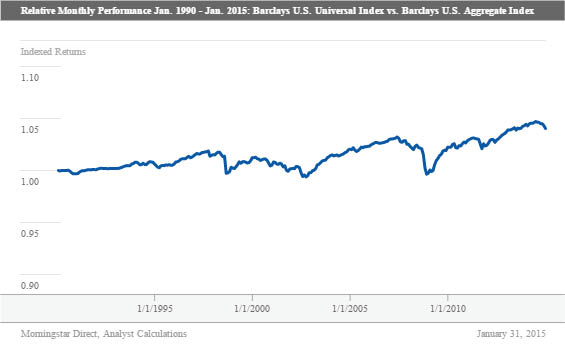
That's not to say the performance of the two indexes is identical. While the Universal Index has better long-term performance and greater yield than the Aggregate Index since its inception, it has tended to underperform the Aggregate Index during periods of market stress. For example, the Universal Index underperformed the Aggregate Index during the market slowdown and corporate bond problems in the late 1990s and early 2000s. It also underperformed its subindex during the 2008 financial crisis. The chart below shows the relative indexed performance of the two from January 1990 through January 2015. An upward-sloping line means the Universal Index outperformed the Aggregate Index. Conversely, a downward-sloping line means the Universal Index underperformed the Aggregate Index.
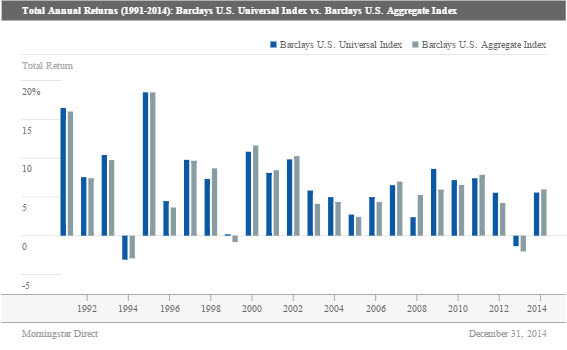
While the Universal Index has historically underperformed the Aggregate Index during periods of market stress, both indexes were able to post positive returns during turbulent markets. For example, in 2008, a year when many actively and passively managed bond funds generated negative returns, the Universal and Aggregate indexes were able to generate 2.4% and 5.2%, respectively. Over the trailing 24 calendar years through December 2014, the Universal Index has had only two negative total return years, 1994 and 2013, while the Aggregate Index has had three (1994, 1999, and 2013). Only in 1994 did the Universal Index generate bigger losses than the Aggregate Index. Further, when analyzing trailing five-year monthly return periods between January 1990 and February 2015, the Universal Index beat the Aggregate Index 72% of the time. The chart below shows both indexes' annual returns since 1991.
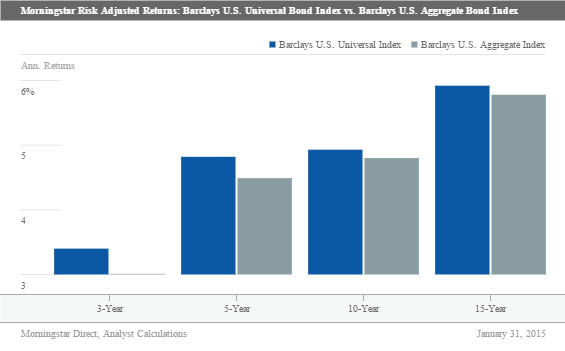
The Universal Index has also historically provided better risk-adjusted returns across a variety of market cycles than the Aggregate Index. The chart below shows the annualized Morningstar Risk-Adjusted Returns for the two indexes over the trailing three-, five-, 10-, and 15-year periods through January 2015. Across each period, the Universal Index generated better Morningstar Risk-Adjusted Returns than the Aggregate Index. This means that over the longer haul, investors were better compensated for this risk in the Universal Index than the Aggregate Index.
Investment Options
While there are many offerings that track the Barclays U.S. Aggregate Bond Index, such as
Using an index fund that tracks the Universal Index, such as IUSB, can help investors reduce the total number of index funds and ETFs they need to either benchmark or gain exposure to the total bond market. For example, investors no longer necessarily need to own a high-yield corporate bond-specific fund, such as
Because of IUSB's relatively small asset base, investors should be mindful of its tracking error to its index, its bid-ask spread, and its premium/discount to its net asset value. Since its June 2014 inception, the fund's tracking error to its benchmark through January 2015 was 0.34%. In comparison, AGG's tracking error to its benchmark was only 0.07%. That higher tracking error can reduce an investor's ability to collect the increased yield and performance of the underlying index.
Nevertheless, investors looking for a broader U.S. bond index to track and are fine taking on incremental credit risk may find that a fund tracking the Barclays U.S. Universal Bond Index offers greater yield and better risk-adjusted returns than traditional Barclays U.S. Aggregate Bond Index funds.
Disclosure: Morningstar, Inc.'s Investment Management division licenses indexes to financial institutions as the tracking indexes for investable products, such as exchange-traded funds, sponsored by the financial institution. The license fee for such use is paid by the sponsoring financial institution based mainly on the total assets of the investable product. Please click here for a list of investable products that track or have tracked a Morningstar index. Neither Morningstar, Inc. nor its investment management division markets, sells, or makes any representations regarding the advisability of investing in any investable product that tracks a Morningstar index.
/cloudfront-us-east-1.images.arcpublishing.com/morningstar/T2LGZCEHBZBJJPPKHO7Y4EEKSM.png)
/d10o6nnig0wrdw.cloudfront.net/04-18-2024/t_34ccafe52c7c46979f1073e515ef92d4_name_file_960x540_1600_v4_.jpg)
/d10o6nnig0wrdw.cloudfront.net/04-09-2024/t_e87d9a06e6904d6f97765a0784117913_name_file_960x540_1600_v4_.jpg)