
The Russell 2000 Index's Achilles' Heel
The index's popularity and concentrated turnover put it at a disadvantage to its peers.
/s3.amazonaws.com/arc-authors/morningstar/56fe790f-bc99-4dfe-ac84-e187d7f817af.jpg)
While low expense ratios make index funds appealing, indexes can incur meaningful transaction costs that are often overlooked. Changes in an index's constituents force the funds that track it to buy and sell the affected securities around the same time. These concentrated trades can move prices away from the index fund managers, creating a drag on their performance. Such market-impact costs tend to be larger among smaller-cap stocks. Here, differences in portfolio construction and the popularity of the index in question can have a noticeable impact on performance. Market-impact costs have especially plagued the Russell 2000 Index and will likely continue to put it at a disadvantage to its peers.
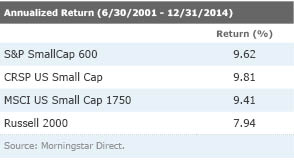
The Russell 2000 Index trailed the S&P SmallCap 600, MSCI USA Small Cap, and CRSP U.S. Small Cap indexes by more than 1.4% annualized from the end of June 2001 (the first common inception date for the indexes) through January 2015. Differences in market sensitivity (beta) and size and value tilts can often explain differences in performance. But even after controlling for these effects, the Russell 2000 Index still underperformed by 1.51% annualized (its alpha). In fact, it was the only one of the four indexes that exhibited a statistically significant negative alpha. This may be because the Russell 2000 Index is one of the most widely followed U.S. small-cap indexes and reconstitutes itself on a single day each year. The resulting trading volume in the stocks that the index's reconstitution affects could cause it to suffer from greater market-impact costs than its peers.
While most changes to the Russell 2000 Index go into effect toward the end of June, investors know what changes to expect at the end of May. That's the date Russell uses to assign the largest 1,000 stocks to the Russell 1000 Index, and the next 2,000 largest to the Russell 2000 Index. There is a small buffer to limit unnecessary turnover between the two indexes. Because Russell 1000 indexers take the other side of the Russell 2000 trades when stocks cross the threshold between the two indexes, these additions and deletions may have a smaller market impact than movements across the Russell 2000 Index's lower bound. However, stocks near the cutoff receive a much larger weighting in the Russell 2000 than in the Russell 1000.
We would expect investors anticipating the actions of Russell 2000 indexers to bid the prices of new additions up and deletions down between the end of May and the effective date of the changes in June. This would hurt the index's performance because it wouldn't add stocks until after they had become more expensive or unload positions until after they lagged.
The Cost of Turnover Antti Petajisto, a former visiting professor at New York University, examined the price effects of these changes in the Russell 2000 Index using data from 1990 through 2005. He did not find a clear pattern among stocks that crossed the Russell 2000 Index's upper market-cap bound, which may be due to offsetting trades from Russell 1000 indexers. A separate study conducted by Yen-Cheng Chang did in fact find a 5% increase in price among stocks in the Russell 1000 scheduled to be added to the Russell 2000 in June using data from 1996 to 2012. It also found a 5.4% decrease in price among stocks slated to be moved from the Russell 2000 to the Russell 1000.
At the Russell 2000 Index's lower market-cap bound, Petajisto found that stocks scheduled to be added outperformed by 4.7% on average between the end of May and June, while deletions across this threshold underperformed by 4.6%. New additions subsequently underperformed during the next two months. These price movements created a drag on the index's performance, which Petajisto estimated at between 38 and 77 basis points per year.
Index arbitragers can move prices against the index by front-running their trades. From this perspective, it may seem like it would be in index investors' interest to make it harder to anticipate these changes ahead of time. But Petajisto persuasively argues that transparency can actually help reduce transaction costs. If the arbitragers weren't there, index managers' trades would still move prices, only the movements would occur on the effective date and may be bigger than if they were spread out over a longer time. With greater lead time, index arbitragers can build their positions (either long or short) and reverse them to meet index traders' demand on the effective date.
So it isn't necessarily the Russell 2000 Index's predictability that is problematic, but rather the amount of assets linked to it, coupled with its concentrated turnover in one part of the year. At the end of December, nearly $41 billion was invested in U.S.-listed Russell 2000 Index mutual funds and ETFs. That doesn't include assets invested in separate accounts, leveraged funds, or index futures, so it likely understates the true amount of money tracking the index. At that time, the aggregate market capitalization of the index's holdings was about $2.15 trillion, implying that these index funds had a 1.9% ownership stake in the index in aggregate. The table below shows the corresponding figures for the S&P SmallCap 600 and CRSP U.S. Small Cap indexes.
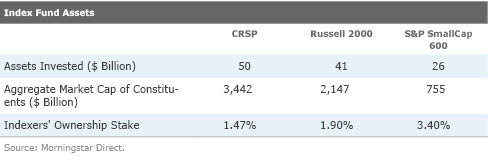
The ownership stakes represent the magnitude of changes in demand that would occur when a stock is added to or removed from each index. These figures may look small, but even small changes in demand can have a big impact on the prices of small-cap stocks. Although there is more money invested in the CRSP index, it has greater capacity than the Russell 2000 because its holdings have a larger aggregate market capitalization. Its quarterly reconstitution promotes more gradual changes to the portfolio, which may also help. The S&P SmallCap 600 Index does not have a regular reconstitution schedule. Instead, the committee that maintains the S&P indexes makes changes as needed. That flexibility allows the committee to spread out changes to the index, which could reduce transaction costs and increase capacity.
Indexes can also reduce transaction costs for funds that track them by applying buffering rules to mitigate turnover. While the Russell 2000 Index applies a narrow market-cap buffer to limit turnover for stocks near its border with the Russell 1000 Index, it does not currently apply any buffer to its lower market-cap bound. So any stock that no longer ranks in the top 3,000 by market cap at the end of May is removed from the index, even if it is very similar in size to the stock that is replacing it.
The CRSP U.S. Small Cap Index gives stocks greater leeway. It targets stocks that fall in the largest 85% to 98% of the U.S. market by market cap. But it won't add a new holding from a neighboring index until it becomes smaller than 89% of the market or makes its way into the largest 96%. When stocks do cross these thresholds, CRSP only transfers half of the position. If the stock remains firmly beyond the threshold at the next quarterly review, CRSP transfers the remaining half. This reduces turnover where it does not significantly affect the index's market-cap characteristics. The S&P SmallCap 600 Index's committee-based approach allows it to take more subjective measures into account before making any changes, which could also help reduce unnecessary turnover.
Investment Options
Small-cap indexes that are less widely tracked relative to the assets they hold, apply generous buffers to limit turnover, and make changes more gradually will likely have lower transaction costs. These characteristics are even better when they are available in a low-cost fund. With this in mind,
Despite its wider following, the CRSP U.S. Small Cap Index may also be a good option for small-cap exposure. Investors can access it through
Investors looking for more-comparable market-cap exposure to the Russell 2000 Index might consider
References Petajisto, Antti. "The Index Premium and Its Hidden Cost for Index Funds." NYU Stern School of Business. Social Science Research Network. April 2010. http://papers.ssrn.com/sol3/papers.cfm?abstract_id=1235604
Chang, Yen-Cheng. Harrison Hong, Inessa Liskovich. "Regression Discontinuity and the Price Effects of Stock Market Indexing." Social Science Research Network. June 2014. http://papers.ssrn.com/sol3/papers.cfm?abstract_id=2288184
Disclosure: Morningstar, Inc.'s Investment Management division licenses indexes to financial institutions as the tracking indexes for investable products, such as exchange-traded funds, sponsored by the financial institution. The license fee for such use is paid by the sponsoring financial institution based mainly on the total assets of the investable product. Please click here for a list of investable products that track or have tracked a Morningstar index. Neither Morningstar, Inc. nor its investment management division markets, sells, or makes any representations regarding the advisability of investing in any investable product that tracks a Morningstar index.
:quality(80)/cloudfront-us-east-1.images.arcpublishing.com/morningstar/T2LGZCEHBZBJJPPKHO7Y4EEKSM.png)
:quality(80)/cloudfront-us-east-1.images.arcpublishing.com/morningstar/HDPMMDGUA5CUHI254MRUHYEFWU.png)