
3 Ways to Bring Fund Fees Into the Light
Fees and expenses are often hidden and complicated. It's time to show investors what they're paying for.

To borrow a term from the technology sector, mutual fund expenses are in need of some "disruption."
Consider share classes. A decade or so ago, mutual fund share-class types were few and easy to compare. An A share was an A share was an A share. The share-class alphabet didn't extend much past I, for institutional, which meant not for individual investors. Today, the alphabet goes all the way to Z; some letters, like R, have a half-dozen variations. Fund families often use the same letter to denominate share classes with different minimums, investor types, or distribution channels. Some companies offer more than 15 share classes of the same fund. Moreover, share-class nomenclature abounds with odd legal terms like 12b-1, vague classifications such as administrative fees, and weird terminology. Can you say instividual?
Investors understand that a mutual fund packages one basic product--portfolio management--with benefits such as advice, a website, and other so-called shareholder services. Still, as with an all-inclusive vacation package, it can be hard for the buyer to determine what he or she is getting for a dollar spent--and that goes for both an individual investor with $10,000 to invest and a more sophisticated institutional investor with $10 million.
Even if investors can figure out what they are paying for, it's difficult to determine if they are getting a good deal relative to the fund's peer group or if they're getting overcharged.
First, investors have to determine the peer group--a task that depends not simply on the fund's advisor fee, which is the same across share classes, but also on its operational fees, which vary by share-class type. Today, it's entirely possible to find two share classes of the same fund from the same family with the same net expenses, but with varying allocations of those expenses to different types of fees.
Then, there is the problem of how expenses are calculated and displayed to the investing public. Just look at how returns are presented as opposed to fees. An annualized return represents compounded results; an expense ratio is a point-in-time snapshot. But like returns, the effects of expenses are magnified over time.
Performance is also shown as a trend, relative to a benchmark. Fund expenses, on the other hand, are shown without context: Is that expense ratio above or below average, and is it part of a downward trend or an upward movement?
Finally, there is the statement of expenses in percentage terms, relative to assets or, even less clearly, as basis points. Yet investors pay for fund management, just as they pay for other goods and services, with their hard-earned dollars. Why not express fund expenses in dollars and cents?
Not All Is Well That Nets Well If there is a defining characteristic of this way of doing fees--which we'll dub Expenses 1.0--it is that while a fund's individual expense components may be above or below those of its peers, discrepancies (especially those on the high side) could be overlooked as long as the grand total, the fund's net expense ratio, was within an acceptable range. In the new world, several developments are challenging this complacency.
First, assets continue to flow to passive funds, making it harder for active managers, particularly those operating in the "core" part of the market, to justify their fees. Exchange-traded funds using strategic beta combine a well-defined approach to buying and selling securities at a cost closer to that of purely passive funds.
On the fixed-income side, low yields continue to make it difficult for funds to beat their peers if they suffer from an expense disadvantage, as fees come out of a fund's income.
Even for alternative funds, there is the threat of replication strategies and pressure from an increasing number of entrants, as well as the negative perception of hedge-fund costs.
Finally, Morningstar research shows that lower-cost investments are more likely to outperform higher-cost investments. This finding is not surprising given that fund expenses, unlike the expenses of any other consumer product, directly reduce performance.
All of this is to acknowledge that while fund expenses should get as much attention as performance, they don't. It is time for a change. The industry should make fund expenses simpler, easier to compare, and more relevant to investors. How do we get there? We propose that the industry take three steps. We call this proposal Expenses 2.0.
Step 1: Tell Investors What Fee Is for What Service While mutual fund fees are classified into accounting categories, investors pay for a different set of services. To put it more bluntly, just tell investors upfront what they're paying for, in a language they might understand and in a way that allows them to more easily comparison shop.
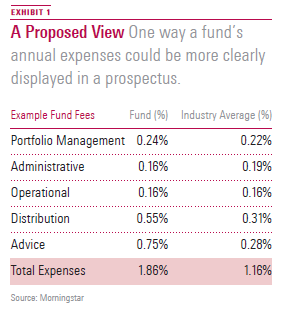
To this end, my colleague John Rekenthaler and I suggest the creation of five fee categories. These basic components would be listed in every fund's prospectus.
- Portfolio Management: Security research and investment management.
- Administrative: The fund company's business costs, aside from investment management (No. 1) and sales/distribution (No. 4).
- Operational: Direct costs of serving shareholders in a mutual fund, including custodial fees, transfer agent fees, customer service, statements, reports, and so forth, as well as the cost of fund boards.
- Distribution: What the fund company spends to grow its business, except for compensating financial advisors (No. 5). Examples include the salesforce, advertising and marketing, and platform fees.
- Advice: The costs of paying financial intermediaries for serving clients--whether that service takes the form of help in selecting and monitoring an investment (or a portfolio of which it is a part) or providing useful information to clients, fund shareholders, platform investors, or qualified plan participants.
Rekenthaler recommends these numbers should be accompanied by an industry average to give context. He suggests the calculation would be an equal-weighted mean of funds sharing the same broad asset class, such as diversified U.S. equity or taxable bond. Exhibit 1 shows what the result could look like.
Putting fund fees in these categories would allow direct comparison between the core function of a mutual fund--the professional management of a portfolio--and that same function carried out in different vehicles, such as a separate account, ETF, collective trust, or some other format.
It would also clarify matters for shareholders and the U.S. Supreme Court (as in Jones v. Harris)--who are understandably confused by three overlapping terms: advisor, administrator, and management. Questions about how much of the difference in costs between mutual funds and other vehicles is due to account size, daily liquidity, and the like versus competitive pressures can only be resolved when we can be sure that the same designation covers the same service.
Administrative fees are confusing even to insiders, especially because funds sometimes have both administrator and administrative fees--the former an "internal" charge assessed at the fund level, paid by the shareholder and received by the fund manager, and the latter an "external" charge assessed at the share-class level, paid by the shareholder but passed on to an affiliate of the advisor or an external firm.
Our proposed taxonomy would designate only internal fund-level fees as administrative; these are the costs of offering the portfolio in a mutual fund format to any investor. Separating internal and external administrative costs would better enable fund boards to assess the profitability of portfolio management, a critical element of the 15(c) advisory contract renewal process.
In practice, fees designated as administrative would shrink for some funds, because share-class specific costs would be moved to operations from administrative. For other funds, however, in particular those employing subadvisors, these fees would rise, as the costs of obtaining, supervising, and allocating to subadvisors would move to administrative from advisor. This distinction should also help investors--and the federal courts, which now have at least half a dozen cases of this sort before them--better address concerns about the advisor/subadvisor spread.
The first two of our fees categories--portfolio management and administrative--involve fund-level expenses. The remaining three--operational, distribution, and advisory--will differ by share class.
Share classes have proliferated as gatekeepers (those people who choose funds) face somewhat contrary mandates: to find the cheapest available share class, to fulfill their fiduciary obligations, and to pick funds whose fees can cover the costs of a retirement plan or platform. Thus, some share classes have higher transfer-agent fees, which tend to be larger as a percentage of invested assets when accounts are smaller. On the other hand, some share classes are largely stripped of operational expenses, because the average account has several million dollars, and operational costs are paid separately.
Distribution fees usually operate under the opaque name of 12b-1 fees, which, depending on whom you talk to and on which day, are: a) a substitute for sales charges and other transaction fees; b) a way to (partially) pay platform and supermarket fees; c) a form of revenue sharing for smaller retirement plans; d) a way to pay for shareholder services that shareholders expect; e) compensation for financial advice; or f) a fee to cover promotion and advertising of the fund, which will eventually produce economies of scale.
While the term 12b-1 has a legal status, it may be time to eliminate its use from shareholder communications and instead designate these fees according to the purpose they serve for the shareholder. That way, for example, a shareholder could more easily determine whether to pay a transaction fee on the purchase of a fund with lower ongoing expenses or to opt for the share class or fund with no transaction fee but higher ongoing expenses.
Finally, it's time to clear up what kind of advice investors can expect when they buy a class of mutual fund. During the load/no-load conflict, purveyors of A shares claimed that for their additional fees, investors received useful advice about matters such as risk tolerance, asset allocation, tax-loss harvesting, and the like. Firms offering direct shares countered that these services could be better obtained and paid for elsewhere.
That battle is thankfully over, but the debate lives on in a share-class format: Should investors pay for advice in the choice of a target-date fund, which is easy to select based on when the investor expects to retire and contains a diversified portfolio of funds, allocated by the fund company rather than a broker or advisor? This question would be easier to resolve if funds made explicit what part of their fees is supposed to be for advice, which investors may, or may not, receive.
Step 2: Make Share Classes Comparable Once it is determined what fees a fund charges, share-class types can be more easily distinguished, compared, and ranked. The share-class alphabet has gone from childishly simple (A, B, C) to fiendishly complex: "Q shares are offered only to investors who satisfy the criteria specified in subsection iv, subject to the terms and conditions of the advisor..."
To create a new share-class system, we should start by assuming that funds charge (or don't charge) operational, distribution, and advisory fees (Nos. 3 through 5 in our expenses categories above). For example, investors who use a fund supermarket want to be able to move a relatively small amount of money among different fund families at their convenience. Advisors who build portfolios for clients may expect a different sort of compensation paid to them, via the fund company, for services rendered. Retirement plans of varying sizes may need lesser or greater services from a fund manager, depending on whether the plan has a few million dollars and is run by the firm treasurer or whether it has several billion dollars and is run by investment professionals.
We propose displaying a basic grid of share classes (Exhibit 2). Within each broad category, share-class types would be distinguished by the presence (or absence) and level of operational, distribution, and advisory fees, as well as investment minimums and investor eligibility.
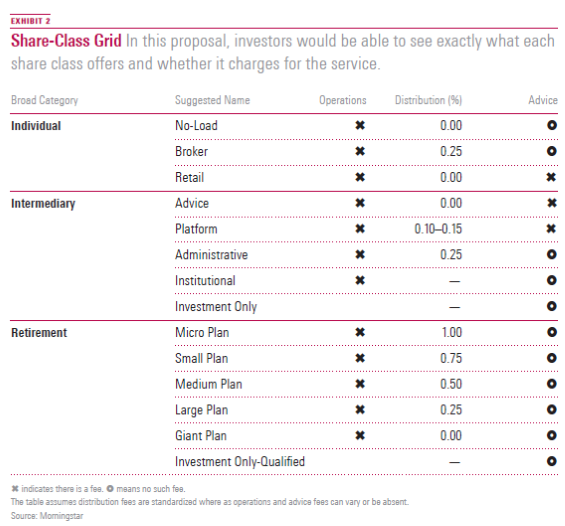
In this formulation, each share class of a fund could be said to have high or low fees relative to others of its type, not only relative to other similar share classes. Moreover, it would be easier for investors to figure out what part of a fund's overall fees are high or low, relative to the comparable type of fees charged by similar funds. For example, an index fund offered to investors in a small retirement plan might have low portfolio management fees, a reasonable administrative fee, a distribution fee equal to similar funds, and no advice fees but high operational fees.
Step 3: Put Expenses in Dollar Terms Once share classes are made more basic and comparable for investors, what remains is how to portray the costs of each type. While the United States is ahead of most countries in terms of the extent of fee disclosure, it lags other developed nations in how expenses are presented to shareholders. We typically see three charts in U.S. prospectuses.
The first kind is the expense table, which breaks down fees and expenses by component and share class and is expressed in percentage points. But that's the main problem with this table. People are not asked to pay for utilities, accountants, or piano lessons in percentage points, but in the mutual fund world, they are.
Perhaps to remedy this defect, U.S. fund prospectuses provide a hypothetical table stated in dollars: If you had invested exactly $10,000 and if the fund earned exactly 5% per year and if you redeemed all of your shares at the end of the period, then you would have paid this amount. Of course, to find out how much they paid, investors still need to multiply by their exact initial investment, and the table does not account for withdrawals or reallocations, and it only works for standard time periods.
Meanwhile, in the prospectus' Statement of Operations in the annual report, we find a table listing the exact amounts the fund spent by specific share classes and components, down to the last dollar.
The first chart is legally binding, but stated in percentage terms. The second chart is in dollar terms but based on assumptions that are rarely if ever true for any given investor. The third chart is based on actual, not assumed, dollar amounts, but for all shareholders together, not a single investor.
Better Ways Fortunately, Canada (as well as Australia, the Netherlands, and the United Kingdom) offers a model that could be adapted to the United States and other markets. In those countries, new regulations governing intermediary and investor reporting require that investors be told explicitly what they pay for operations, transactions, and fund management--in the country's currency (dollars, euros, or pounds).
Given that different sorts of fees are already broken out by fund managers, intermediaries, and transaction agents, and given that broker/dealers and others already personalize performance reporting for their clients, it would seem very possible for fund companies to separate these expenses, personalize them for their shareholders, and state them in dollars (or pounds or euros).
But why stop there?
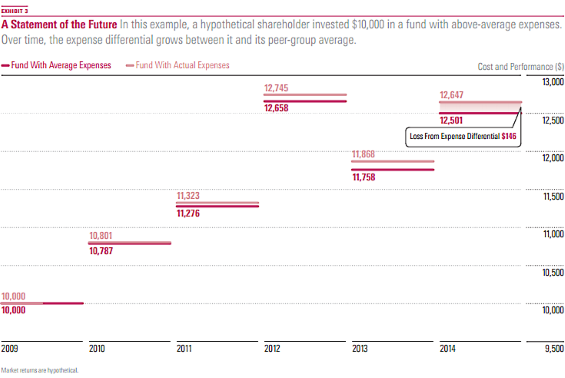
Expenses reporting lack three critical elements, each of which is present on the performance side: time, compounding, and context. Investment performance displays long-term annualized returns relative to a benchmark. After all, unlike a typical consumer product, a fund's expenses directly affect its performance. All things being equal, higher expenses mean lower performance, and vice versa. A dollar earned by the portfolio manager or other service provider is a dollar less that the investor receives.
Borrowing from the familiar performance displays, we propose a type of bar chart (Exhibit 3: Click to enlarge).
Gaining Acceptance Where dollar disclosure has been mandated or proposed in the past, the objective has been pretty narrow: to direct investors toward "hidden" fees and trailers, to alert them that they may be paying for services they don't receive or need.
The goal of our proposals in Expenses 2.0 is much more ambitious. Fund companies should denominate fees in terms of services provided, rationalize share-class categorizations based on whom each is intended for and what they pay for services beyond portfolio management, and portray fees in actual dollar terms, indicating their direct effect on personalized performance.
Each of these ideas is entirely feasible. Consider that on the performance side the fund industry has benefited greatly from standardization. Investors can compare past performance over standardized time periods, gains (or losses) are stated in dollar terms, and risk ratings are based on common statistical measures.
It's clear that the industry's move to performance-reporting simplicity, transparency, and plain terminology has increased investor trust in funds they own. We need to take similar steps with expenses. Even amid the current confusing state of Expenses 1.0, investors in huge numbers are gravitating toward better-performing, lower-cost funds. This transformation has created greater competition--both inside the open-end mutual fund world and outside of it. Expenses have become part of the language that investors use to talk about all types of investments. We think Expenses 2.0 will greatly accelerate this industry trend, to the obvious benefit to all investors.
This article originally appeared in Morningstar magazine. To learn more about Morningstar magazine, please visit our corporate website.
Paul Ellenbogan, Ph.D., is director, board consulting services, with Morningstar Investment Management.
The opinions expressed herein are those of Morningstar Investment Services, are as of the date written and are subject to change without notice, do not constitute investment advice and are provided solely for informational purposes.
Please note that references to specific securities or other investment options within this piece should not be considered an offer (as defined by the Securities and Exchange Act) to purchase or sell that specific investment. Past performance does not guarantee future results. Morningstar Investment Services shall not be responsible for any trading decisions, damages or other losses resulting from, or related to, the information, data, analyses or opinions or their use.
©2015 Morningstar Investment Services, Inc. All rights reserved. Morningstar Investment Services, Inc. is a registered investment advisor and wholly owned subsidiary of Morningstar, Inc. The Morningstar name and logo are registered marks of Morningstar, Inc.
/cloudfront-us-east-1.images.arcpublishing.com/morningstar/ZKOY2ZAHLJVJJMCLXHIVFME56M.jpg)
/cloudfront-us-east-1.images.arcpublishing.com/morningstar/IGTBIPRO7NEEVJCDNBPNUYEKEY.png)
/cloudfront-us-east-1.images.arcpublishing.com/morningstar/HDPMMDGUA5CUHI254MRUHYEFWU.png)