
GDP: Back to Trend, Not Down the Drain
Faulty seasonal factors, weather, and issues at ports have given the illusion of hypervolatility in recent GDP data, writes Morningstar's Bob Johnson.

Even though it's always a guessing game, I think investor fears have changed. They've shifted from the timing of a Fed interest rate hike and an overheated U.S. economy to slumping economic growth rates. As I suspected, the initial GDP estimate for the fourth quarter, which looks a tad conservative to me, was a real dose of cold water. The seemingly poor result sent the Dow down by over 250 points on Friday.
The halving of the GDP growth rate from 5% in the third quarter to 2.6% in the fourth quarter was a reality check for those thinking that the economy had hit escape velocity with 3%-4% growth as far as the eye could see. Readers of this column know that there is nothing fundamentally wrong with the economy, that the fourth-quarter growth rate slump was unusually predictable, and that U.S. GDP growth is likely to continue on its 2.0%-2.5% trajectory.
Reflecting the slower growth outlook, bonds around the world managed to surge yet again. The U.S. 10-year bond is now yielding just 1.67% (down from 1.8% last week and over 2.1% at the end of 2014), and the German 10-year is at a miserly 0.3%. Shorter-term German bond yields are now firmly in negative territory.
Commodities had a great week, rising just under 3% as oil appeared to have found a bottom. In fact, oil was up $3.74 to around $48 on Friday, its best move since 2012. Drastically falling rig data released on Friday by Baker Hughes triggered the quick reversal. In the latest week, the rig count fell by 94 units; the count is now down by about 24% since last summer.
Most developed equity markets outside the U.S. were little changed this week as slow growth prospects had already been digested over the past month. However, the prospect of U.S. growth slowing sank the U.S. market, with the S&P 500 down almost 3%. Emerging markets had a bad week, too. More turbulence in Russia and apparently slowing growth in the United States--the key export market for many countries--weighed heavily on weekly returns. Continuing issues with Greece, which seems to backing away from austerity measures after last week's election, certainly weren't helpful, either.
Besides the GDP data, the only other major economic report of consequence was the durable goods report, which seems to be indicating the best days for the manufacturing sector may be behind us. Pending home sales also tumbled, which means the economy will have to wait for springtime to get much help from the housing sector. That said, the quirky new home sales report showed some modest signs of life in December, as we detail later in this report. Home price growth rates also appear to have bottomed at what we believe to be a sustainable rate after a couple of years of hypergrowth that brought housing market growth to a screeching halt in 2014.
GDP Growth Slows Back to Trend; Consumers Surge While Business and Government Slump Sequential GDP growth of just 2.6% for the fourth quarter was well below the consensus of 3.2% but well within our forecast range of 2.5%-3.0%. In many circumstances a 2.6% rate would be something to celebrate. However, following growth of 4.6% and 5.0% in the previous two quarters, there is some worry on the Street that the economy is slowing. Please.
The U.S. remains well within its trend line growth rate of 2.0%-2.5%, which is virtually unchanged over the past four years. Any perceived hypervolatility in the sequential quarterly data is related to faulty seasonal factors, weather, and issues at ports. In 2014, weather wrecked first-quarter results but made the second quarter and the third quarter look exceptionally strong. In addition, wacky seasonal factors for federal government spending were a big plus in the third quarter but came back to haunt the fourth-quarter report (government added 0.8% to the third quarter and took away 0.4% from the fourth quarter).
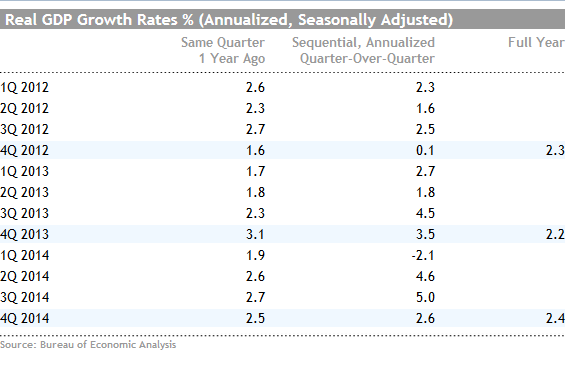
Theoretically, the sequential data should be much faster at spotting a slumping or booming economy. That is, if weather and seasonal factors didn't mess things up. The sequential numbers--the ones always quoted in the financial media--are close to being a laughingstock. Does anyone really think the economy grew 5% in the third quarter and shrank by 2.1% in the first quarter, as shown above?
Luckily, comparing fourth-quarter to fourth-quarter data or looking at all four quarters of 2013-14 produce relatively similar growth rates of 2.5% and 2.4%, respectively. The full-year-over-full-year data probably does a better job of wiping out weather effects, but the comparison with the year-ago period might provide slightly more timely warnings of a shifting economy.
Even the category data starts to make more sense when looked at year over year. Our readers are used to looking at a very jumpy contribution table by sector. For example, inventories might add more than 1% to GDP in one quarter, then exactly reverse itself in the following quarter. However, at the end of the day, inventory changes viewed over a full-year period have had a negligible effect on the GDP calculation.
The contribution table methodology has always been one of our very favorite techniques for analyzing the economy. It combines relative size of a category with its actual growth to determine the "weighted" effect on the GDP contribution. Some categories are huge but move little. Other categories move a lot but are minuscule. When all the contributions are summed together, they should add up to the total GDP figure. Looking at the table, it's important to note the biggest contributors as well as what's shifting around from year to year.
Net, the full-year-over-full-year GDP growth rate totaled 2.4% in 2014 versus 2.2% for 2013 as consumers held their own, imports surged, and the government sector improved substantially. Business investment was a small help, too.
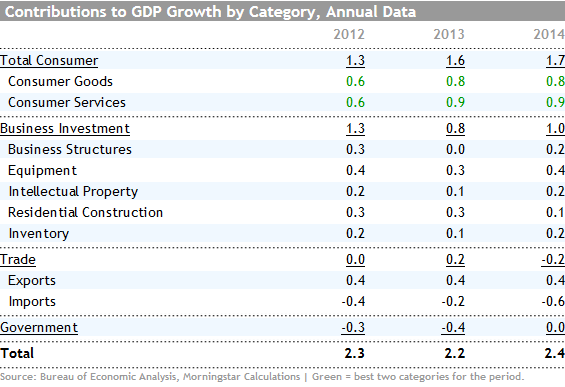
As usual, the consumer services and consumer goods sectors battled it out for the most influential category in 2014 with services edging out goods with a 0.85% contribution compared with 0.79%. Together they explain 1.64% of the total GDP growth of 2.4%, about 70% of the total, not far off of their overall weighting. That's why I always focus on the importance of following the consumer.
Nonresidential investment (that includes structures, software, and equipment) was the next-biggest factor in the GDP calculation. 2014 was a good year for investment, representing one of the bigger improvements comparing 2014 with 2013, moving from a 0.37% contribution to 0.75%.
Exports remained rock-solid at a 0.41% contribution, holding up surprisingly well, even in the face of a slowing world economy. Imports, which are a subtraction from GDP, took away 0.64% from the GDP calculation, a substantial deterioration from year-ago levels. A strong consumer in general, and more iPhones in particular, both helped boost imports.
For the fourth straight year, government remained a detractor from the economy, taking 0.03% off the 2014 report. However, that is a huge improvement from the 0.45% subtraction in 2013. Housing was a huge disappointment with a minuscule contribution to GDP in 2014 that was down meaningfully from the previous year.
In sum, 2014 was solid, but it isn't any kind of new normal or breakout that many found in the unusually strong second- and third-quarter GDP reports. I think Friday's report proves that was more illusion than reality. I am sticking with a 2.0%-2.5% growth rate for 2015 that has served me so well over the past several years. Yes, the consumer will do better because of falling gasoline prices. However, business spending (hurt by smaller investments in the energy patch and a smaller need to expand because of a smaller export market) is likely to offset those gains. Housing should do a little better in 2015 and government might actually turn into a contributor. And falling exports are likely to weigh on 2015 results.
Durable Goods Orders Continue to Soften; the Best Days for the Manufacturing Sector Behind U.S. For several months we have reported on a manufacturing sector that has begun to show some growing pains after some really dramatic improvements earlier in the year. Industrial production figures for all 2014 were the best since the 2010 recession-related bounce and grew at almost double the rate of long-term averages. However, those year-over-year growth rates have started to move down, and purchasing manager surveys, while still elevated, are also moving downward. A softening manufacturing economy may be one of the factors that holds back the GDP calculation in 2015.
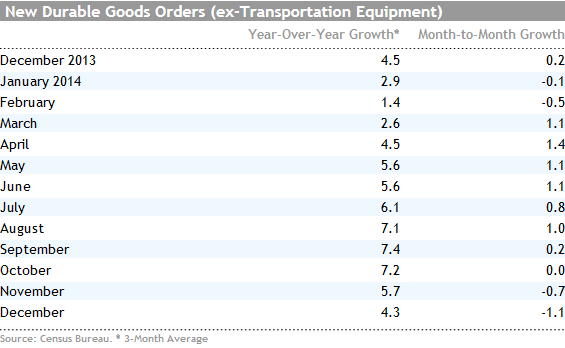
This week's durable goods orders reports further suggest a slowing manufacturing economy. The headline durable goods report was down 3.1% in December, following a 2.1% decline in November. Those are month-to-month declines and not year-over-year figures. They also include the highly volatile airliner segment and other transport equipment. The news even without those pesky airliners (which were down 55%) is hardly better, with core orders down 1.2%, 1.3%, and 0.8% for the months October through December. The sector sequential data didn't look so hot either, with five of seven major categories down in December. I suppose the silver lining is that all seven categories were down in November, so December wasn't quite as bad as the prior month.
The averaged data on a year-over-year basis, excluding the transportation orders, shows a slowing pattern. But at least this metric hasn't moved into negative territory like the month-to-month data, as shown below.
I believe the softening orders data, which are often indicative of manufacturing data two to three months out, are the result of a combination of factors. Exports, especially of heavy machinery, are hurting from slowing commodity processing around the globe. The U.S. housing market has been in a bit of a funk too, which isn't helping matters. Finally, troubles in the oil and gas fields may be creeping into this data set.
The problem with oil industry softness is that it doesn't affect just one category. It's relatively hard, if not impossible, to determine which portion of the 2014 manufacturing boom was attributable to oil. Computers to drive the drills, tubular steel to transport the oil, oil rigs, and industrial-strength pumps (machinery) could all take a hit in the months ahead. I suspect that the positive effects of the oil industry have largely flown under everyone's radar. For most of the year, the manufacturing sector performed well above expectations. Perhaps the oil industry was the secret sauce to that outperformance. That is why I am at least a little worried about manufacturing in 2015.
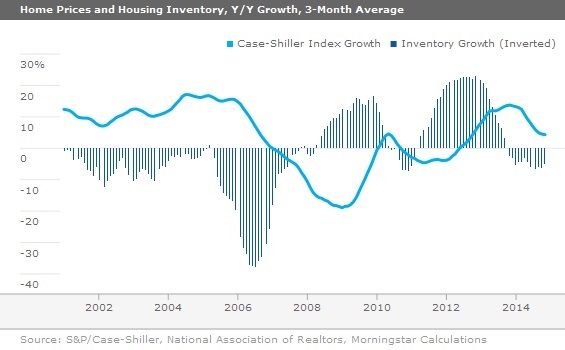
Home Price Growth Begins to Reach Equilibrium (by Roland Czerniawski) Home prices increased in November, according to the three major home price indexes that we track. On a year-over-year, three-month average basis two indicators, FHFA and CoreLogic, showed that growth has picked up modestly, while the most widely followed S&P/Case-Shiller 20-City Composite fell to a 25-month low of 4.3%. The price growth has moderated significantly since late 2013. The growth rate now appears to be much more sustainable.
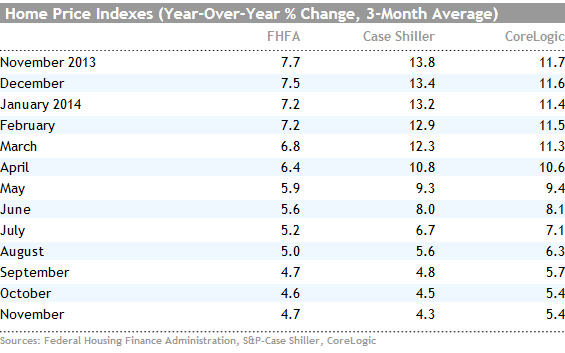
Historically, the average home price growth since the 1980s has been 3.4%, according to the FHFA, and it is not a coincidence that this figure is not far off from the nominal income growth. In most cases, price growth cannot exceed income growth for extended periods of time. The exception is when mortgage rates are falling and lending standards and down payment requirements are shrinking. That was the case early in this century. What we're seeing now is that income growth has picked up modestly and home price growth has been slashed in half. In fact, nominal income growth is running around 3%-4%, likely putting a similar floor under the rate of home price appreciation. Combining income growth with some modest easing in credit terms, we are currently forecasting home price growth of 4%-5% for 2015. The mini-boom of 2013 and 2014, one of the largest two-year increases, was due to the fact that income growth had been running well ahead of home price growth since the recession ended. Looser lending standards were surely a help, too.
Another signal that supports our thesis of home price growth stabilization is the housing inventory data. Typically, peaking inventory growth rates are an excellent leading signal of bottoming price growth rates. While the inventory picture is not crystal clear yet, it appears that inventory growth peaked in mid-2014 and has been declining since then. This could mean that the housing market has a solid chance of stabilizing within our forecast range of 4%–5% price appreciation. We believe that moderating home price growth is a positive development, as rapidly rising prices have ruined affordability in late 2013 and early 2014, which had a crippling effect on the housing recovery. The much healthier pace of price increases that we are currently experiencing will aid affordability, while still helping many underwater mortgage holders to emerge out of the slump.
Pending Home Sales Slump Again It is a very difficult time of year to get a reading on the housing market because weather, school, and holiday issues severely complicate the analysis of housing data. So, making blanket conclusions from December/January might represent a bit of over-reaching. Despite these complications, it doesn't look like the housing market is picking up a lot of steam. The pending Home Sales Index for December declined over 4% from November to December. Given that this index is useful in projecting existing-home sales over the next two or three months, the short-term outlook for housing is for continued sluggishness at best. The December 2014 over December 2013 data looks better, with a 6% increase. However, weather this December was unusually good while last year was unusually bad. Just mustering a 6% improvement with a massive positive swing in weather conditions and a dramatically improved economy is disappointing, to say the least. After a nice improvement between 2010 and 2013, this metric is showing signs of plateauing.
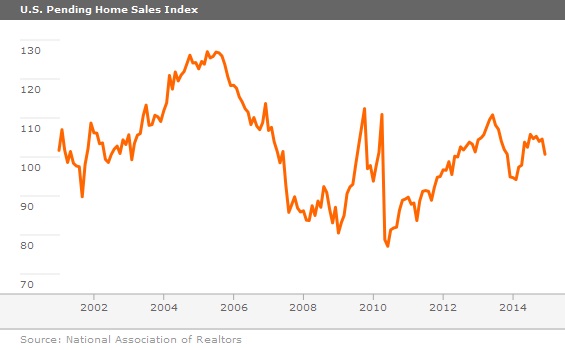
The same pattern shows up in existing-home sales that were down 3.1% for all of 2014, following 9% gains for both 2012 and 2013. Rapidly rising prices in 2013 and limited wage growth in 2014 combined to limit home sales growth in 2014. Slowing price growth, relatively low interest rates, and some credit easing should mean a better year in 2015. The National Association of Realtors is expecting 6% growth in 2015 to 5.26 million units. The Realtors report also suggested that the Pending Home Sales Index is currently at just about 100, its same reading as in 2001. Existing-home sales in 2001 were in the range of 5.0 million-5.5 million with the Pending Home Index suggesting a similar range for 2015.
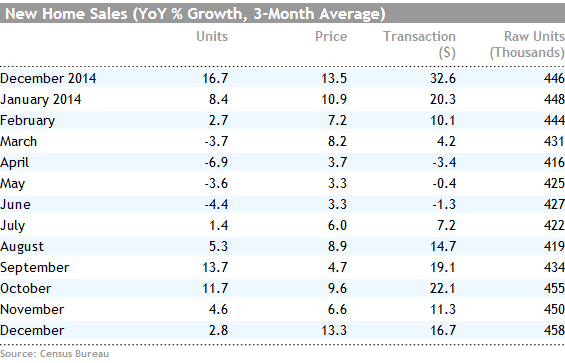
New Home Sales Finish Slow Year on a Positive Note (by Roland Czerniawski) Sales of new single-family homes were at 481,000 units on a seasonally adjusted annual basis in December, marking an 11.6% increase over November's revised-down 431,000 figure. Year-over-year, new home sales growth stood at 2.6% when averaged for three months.
While December results were surprisingly good, the actual annual number of new homes sold in 2014 was just 436,000 units, a meager 1.2% above the 2013 figure. Rapidly rising prices are one of the reasons new home recovery continues to be slow. Average new home prices stood at $299,200 at the end of 2012; $321,200 at the end of 2013, and now it is up even higher at $377,800 in December 2014. Headwinds such as stagnant income, ballooning student loans, and tight lending standards keep many first-time homebuyers from entering the market. As a result, builders try to protect their profits by delivering pricier higher-end homes on now fairly limited land resources. This has made new homes, on average, significantly less affordable in 2014.
Flood of Data to Start off February, Including Employment, Trade, Manufacturing, and Autos It's a little hard to call any of next week's reports pivotal, though I am hoping for a few good insights. As we fully note above, the manufacturing sector developed a serious case of the blues at the end of 2014 following a very strong year overall. The question is, was the end-of-year slowdown a mere cold or the start of something much more serious? Next week's ISM purchasing managers' report should give us at least a few clues. The ISM index has been working its way downward from a reading of 59 this summer. The consensus is for the nationwide ISM index for January to be unchanged at 55. A still-retreating oil industry and a world economy looking for a bottom make this forecast look at least a little overly optimistic. On the other hand, the normally predictive data out of the Chicago PMI (released on Friday) did indeed manage a small improvement in January after a relatively meaningful slide in November and December. I hate to go against the Chicago data, but I still think the national index will drop to less than 55. Certainly no disaster, but 2015 is going to be a little rougher for manufacturers.
Auto Sales Likely to Settle Back Like a lot of statistics, January isn't a great month to get a feel for the auto industry. A combination of weather, lack of new models, holiday bills, and a hangover from holiday promotions make January one of the lowest sales months of the year. The consensus estimate (which is seasonally adjusted) is expected to fall from 16.8 million to 16.5 million units (annualized) between December and January. That would amount to about an 11% increase over January 2014, which bad weather crippled. The improvement in February will look nearly as good before the growth rates settle back into the very low-single digits. For full-year 2015, a growth rate of just 3% or 4% compared with almost 6% in 2014 appears to be in the cards. The key question now is, will slumping oil field activity limit pickup truck sales faster than other consumers can spend their newly found gasoline money on a new vehicle?
Employment Growth Expected to Remain High; I Am Not so Sure I think I am going to just sit back and watch the employment report this time around. This is the month they make all the benchmark revisions that true up payroll and tax data with survey data. So a really good or bad January might be the result of large revisions to November and December data or even further back. The magnitude of the adjustments always makes for fascinating reading. Those awful seasonal adjustment factors are also trued up in this report.
I can make a case that a broad range of employment data may need to be revised down. But the case for an upward revision in the old data is probably just as good. On the upward side, revisions generally go in the direction of the monthly data. It sometimes takes a while for the data to catch up with improving trends. On the other hand, the personal income data has been the subject of monthly downward revisions since midyear. Once-stellar income gains are now merely good. A good part of those losses were in wages, which suggests that the employment data wasn't as good as we all thought. However, we have been wrong about this for three months running with revisions running to the upside--and not the downside. For the record, we added 2.95 million jobs for the full year according to the last report. Let's see what the new revisions show. If nothing else, I suspect that some of the big monthly bumps (huge April and November and soft August) get smoothed out, at least a little.
Ex the revisions, I suspect job growth in January was about 220,000, below the consensus of 245,000 and the 252,000 jobs added in December. The bull case is that not many retail jobs were added in December so there aren't as many people to fire in January. And the seasonal adjustment factor is massively positive in January. The bear case centers on oil field-related job losses beginning to creep into the report, and there has to be a payback at some point for the massive 353,000 gain in November. Weather conditions were also modestly more favorable in December than they were in January.
Trade Data Expected to Improve The consensus is for the trade deficit to drop from a relatively low level of 39.6 million to 38.5 million in December on the back of lower prices for oil imports. Interestingly, the government is not nearly as bullish, forecasting one of the largest deficits of the year for the very same period. I am not sure which is right, but if the Street proves to be correct, there could be a large, positive revision to the fourth-quarter GDP calculation. Some combination of iPhone imports and a much more competitive oil market may be behind the government's pessimism. In a world where everyone is fighting for oil market share, there may be less interest in U.S. petroleum-based products for export. The truth probably lies between the government and forecaster estimates. Still, it's hard to square the very large divergence in government and private sector estimates.
/cloudfront-us-east-1.images.arcpublishing.com/morningstar/CGEMAKSOGVCKBCSH32YM7X5FWI.png)
/cloudfront-us-east-1.images.arcpublishing.com/morningstar/LUIUEVKYO2PKAIBSSAUSBVZXHI.png)