
The 6 Best Passive Large-Cap ETFs
Passive large-cap funds won the performance battle in 2014.

The S&P 500 outperformed 80% of active managers in 2014 and beat the small-cap Russell 2000 Index by more than 8 percentage points. Strong fund flows reflected investor preference for large-cap funds as the three exchange-traded funds with the strongest flows in 2014 each track the S&P 500, an index of large-capitalization stocks. While the S&P 500 is the most popular, it is not the only large-cap index that investors can choose.
A total stock market index fund is usually the most efficient way for index investors to get exposure to the U.S. stock market because they offer comprehensive coverage of the market with very low turnover. However, there are at least two scenarios where it could make sense to hold separate size segment funds. They could be appropriate for investors who want to give an overweighting to certain size segments, such as small-cap stocks, when they believe that segment will outperform. However, it is very difficult to consistently get these calls right. Because different size segments tend to exhibit different risk and return characteristics, investors could also use these funds to exercise more control over their strategic portfolio allocations. In addition, investors may use size segment funds to balance out a portfolio of active managers.
The chart below illustrates the annualized volatility and return for stocks sorted by market capitalization and grouped by quintile dating back to 1926. While smaller-cap stocks have generally offered higher returns over the very long term, there have been several market cycles that favored different size segments. The S&P 500 beat the Russell 2000 each year from 1994 through 1998, but that reversed in each year from 1999 through 2004.
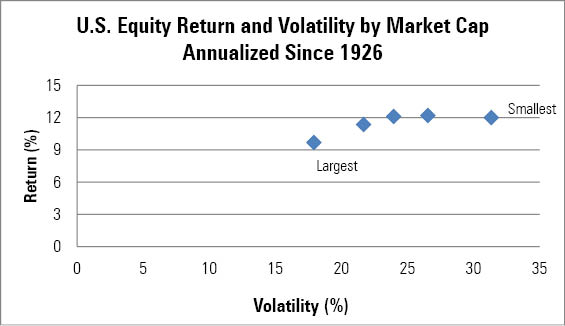
- source: Morningstar Analysts
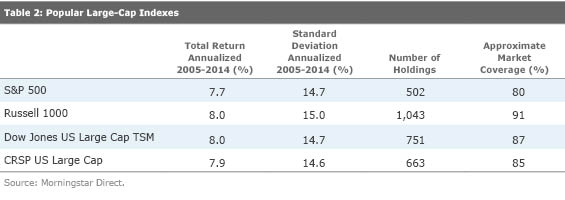
There is no industry-agreed-upon definition for large cap, so each index provider defines the large-cap universe in its own way. Morningstar defines large cap as all of the largest stocks, which in aggregate make up 70% of the market value of all stocks; this currently corresponds to stocks with a market cap larger than $17 billion. In terms of index performance, it's a statistical dead heat. Because the indexes have similar risk and return profiles, the choice of which ETF to use largely comes down to factors such as fees, liquidity, tax efficiency, and personal issues such as which brokerage platform is used or how the other assets in the portfolio are positioned.
There are 11 ETFs that track market-cap-weighted passive indexes, excluding mega-cap and total stock market funds that also land in the large-blend Morningstar Category. In terms of fees, they charge between 0.04% and 0.20%. While these fees are low relative to the average large-blend mutual fund, which charges 1.1%, there is no reason to pay more than necessary. We can eliminate the funds charging 0.20%. In fact, it is somewhat odd that iShares is willing to charge just 0.07% for
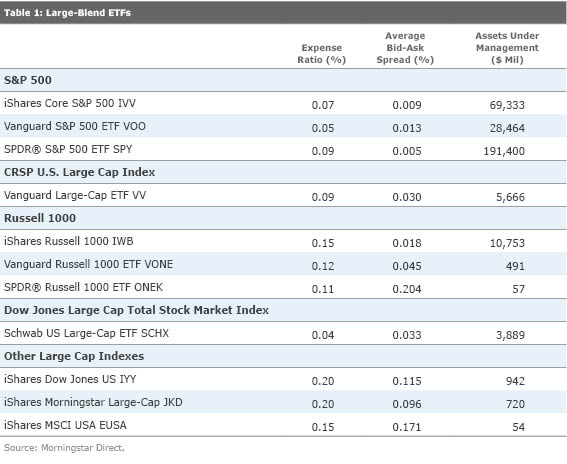
The expense ratio is just one aspect of cost. Trading costs also have an impact on total return. While the underlying stocks in each of these indexes are mostly the same and are all liquid, some of the ETFs with fewer assets trade less and have wider bid-ask spreads. For example, the iShares MSCI USA EUSA has just $57 million in assets and trades less than $1 million of volume a day. The average bid-ask spread of 17 basis points would quickly eat into the returns of a frequent trader. In contrast,
U.S. equity ETFs tend to be tax-efficient because of their ability to transfer low-cost-basis shares out of the portfolio through in-kind redemptions. However, there have been instances where they have issued capital gains. This is more likely to happen to ETFs with a smaller asset base or trading volume or that happen to switch indexes. The only ETF in this group that has issued a capital gains distribution in the past 14 years is SPDR Russell 1000 ETF ONEK.
Personal factors also enter into the equation. Brokers such as Schwab, Vanguard, and Fidelity offer trading commission discounts for using certain ETFs (check with your broker). A $10 savings per trade can have a big impact for those investing small sums or making frequent trades. Investors should also consider how their choice will have an impact on their overall portfolio. Investors who already have assets with one index family may want to stick with that suite of index products. For example, if you have a Russell 2000 fund for small-cap exposure, you may want to use a Russell 1000 fund for large-cap exposure to avoid overlaps.
After eliminating the higher-cost, less-liquid, and less-tax-efficient ETFs from the list of 11, we are left with IVV, SPY, IWB,
S&P 500
Unlike the other indexes listed, the constituents of the S&P 500 are selected by a committee that has some discretion over which stocks make it into the index and has stricter rules regarding public float and profitability for new index additions. These rules do not have much of an impact for large caps but can have a bigger impact for small caps. In addition, S&P does not follow a set rebalancing calendar, which helps to keep turnover low. Of the four indexes, S&P has the highest average market cap and includes the fewest mid-cap stocks. The lower exposure to mid-caps explains why the S&P 500 slightly underperformed the other indexes. However, the S&P MidCap 400 outperformed most mid-cap indexes. Of the three ETFs tracking the S&P 500, we prefer IVV or VOO over SPY. While SPY is the most liquid, it is technically organized as a unit investment trust, a more restrictive legal structure, which prevents it from engaging in securities lending, reinvesting dividends, and using index futures. Consequently, SPY has lagged the S&P 500 by more than its expense ratio.
CRSP US Large Cap Index This benchmark is more comprehensive than the S&P 500. It targets the largest 85% of the market and applies buffering rules to limit turnover. This sweeps in both large- and mid-cap stocks. VV adopted this index in 2013. Vanguard has a history of working with index providers to refine best practices and negotiate better fees. In fact, it previously switched some index funds to MSCI from S&P.
Russell 1000 The Russell 1000 Index dips even deeper into mid-cap territory. The average market capitalization of its holdings is $54 billion compared with $72 billion for the S&P 500. The index includes all but six of the stocks that are in the S&P 500 as well as many more mid-caps. IWB is lower-cost and has better liquidity than the ETFs from Vanguard and SPDR that track the same index.
Dow Jones US Large Cap Total Stock Market This index tracks approximately the 750 largest U.S. stocks and is available through SCHX. Schwab offers a suite of ETFs based on Dow Jones indexes. The Dow Jones Small Cap Total Stock Market Index includes the next largest 1,750 stocks, while the mid-cap index encompass 501st to 1,000th largest stocks. S&P acquired the Dow Jones indexes business in 2010. Schwab's size segment funds have the lowest expense ratios in their respective categories, and liquidity has improved as these funds have gained assets.
Disclosure: Morningstar, Inc.'s Investment Management division licenses indexes to financial institutions as the tracking indexes for investable products, such as exchange-traded funds, sponsored by the financial institution. The license fee for such use is paid by the sponsoring financial institution based mainly on the total assets of the investable product. Please click here for a list of investable products that track or have tracked a Morningstar index. Neither Morningstar, Inc. nor its investment management division markets, sells, or makes any representations regarding the advisability of investing in any investable product that tracks a Morningstar index.
/cloudfront-us-east-1.images.arcpublishing.com/morningstar/24UPFK5OBNANLM2B55TIWIK2S4.png)
/cloudfront-us-east-1.images.arcpublishing.com/morningstar/T2LGZCEHBZBJJPPKHO7Y4EEKSM.png)
/d10o6nnig0wrdw.cloudfront.net/04-18-2024/t_34ccafe52c7c46979f1073e515ef92d4_name_file_960x540_1600_v4_.jpg)