
For Passive Funds, a Stronger Link Between Fees and Performance
When it comes to fund performance, you don't always get what you pay for.

When shopping for products of unknown quality, price forms a cue that shoppers can use to differentiate products. It is often a safe assumption that a higher-priced product offers better performance than a lower-priced product. For instance, the Porsche 911 lists for $93,000 while the Chevy Malibu will set you back $20,000. But this is not always the case, particularly with fund investing. Unlike the Porsche, there is no cachet from buying a high-priced fund. Still, price can be useful when predicting results--though not in the way fund companies would like.
Morningstar's Analyst Rating for funds is based on five pillars: People, Parent, Process, Performance, and Price. The first three of these pillars are somewhat qualitative, while Performance and Price are much more quantitative. Price is the most tangible, both in terms of the impact of price on fund performance and comparability across funds. On average, we find that the higher the price of a fund, the worse its performance tends to be, and the link between fees and performance is stronger for passive funds.
The chart below illustrates the relationship between price and performance among U.S. equity funds. It shows the average alpha (excess returns after adjusting for risk relative to the category benchmark) for all funds grouped into five quintiles by expense ratio. The y-axis shows the average alpha and the position on the x-axis indicates the average expense ratio for the group. We included all U.S. equity funds that existed five years ago and survived through today. Because some funds have performance-based fees, we used the 2009 annual report expense ratio rather than the expense ratio during the sample period. This also simulates the results of picking funds based on currently available information and examining future performance.
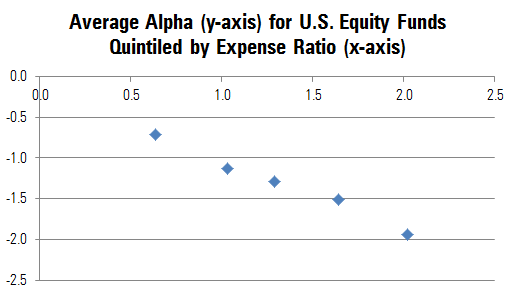
As the chart illustrates, there appears to be an inverse relationship between fees and performance. The lowest-fee quintile has an average expense ratio of 0.64% and an average alpha of negative 0.71% while the highest-fee quintile has an average expense ratio of 2.02% and an average excess return of negative 1.94%. However, grouping the funds into quintiles masks the tremendous variability in the relationship between fees and performance, which is better illustrated in the following graph.
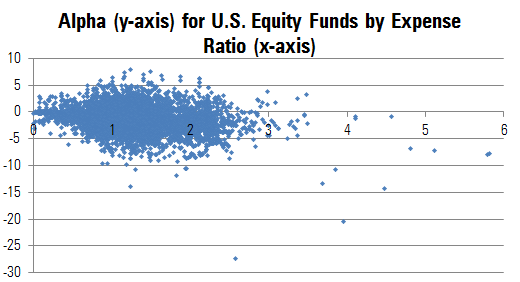
Here, the relationship appears much less precise. In fact, a regression of alpha on expense ratio has an R-squared of just 6%, suggesting that fees explain a small portion of the overall variability in fund performance. However, there are a few issues that may obfuscate this relationship. The chart above includes all U.S. equity funds, even though small-cap funds have higher expense ratios than large-cap funds. It also includes all available share classes despite the fact that low-cost institutional share classes must outperform high-cost retail share classes of the same fund. Also, the relationship between fees and performance might be different for active and passive funds. Because passive funds seek to match an index less fees, the relationship between fees and performance might be stronger among them. In contrast to passive funds, well-run active funds have a better chance of earning back their fees.
In order to address these issues, we narrowed our focus to large-cap U.S. equity funds and removed multiple share classes of the same fund to get a cleaner read on the link between fees and strategy performance. We also grouped active and traditional broad passive funds separately and removed most niche index and strategic beta funds (index funds that make active bets in an attempt to outperform traditional indexes). The results are shown in the following chart.
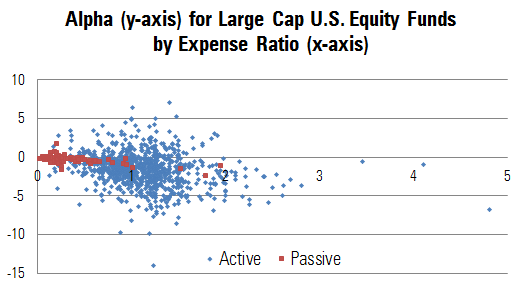
In this chart, the relationship between fees and performance is a bit clearer. For active funds, there is still a tremendous amount of variability, but there appear to be more dots in negative territory as we move from lower- to higher-cost funds (from left to right on the chart). Passive funds seem to hew closer to a straight line.
Quantifying this relationship with a regression that expresses the expected alpha as a function of the expense ratio highlights the negative slope. For active large-cap funds, the expected alpha is approximately negative 1.21 times the expense ratio. In other words, a fund with an expense ratio 10 basis points above the average would be expected to deliver an alpha 12 basis points lower than average. While the relationship is significant, the R-squared is only 6%. Despite the poor fit of the model linking fees to performance for active large-cap funds, lower-fee funds still had a better chance of outperforming on average. This simply indicates that, while fees are predictive of performance, there are many other factors that matter. For passive large-cap funds, the R-squared is 38%. This means that there is a cleaner relationship between fees and performance for passive funds than active funds.
In the sample studied, active funds in the lowest expense ratio quintile had a 28% chance of earning a positive alpha compared with just a 15% chance for those in the highest-cost quintile. But the relationship is even stronger for passive funds. About 52% of passive large-cap funds in the lowest-cost quintile earned a positive alpha (however small), while none of the funds in the highest-cost quintile did.
This suggests that investors can increase their probability of success by selecting low-cost funds. Fortunately, there are a lot of low-cost passive and active funds to choose from.
Among active funds, Price is one of five pillars taken into consideration in the Morningstar Analyst Rating for funds. Investors can screen for Morningstar Medalist funds and sort and screen by price here. When there are multiple funds that offer similar exposure, the lowest-cost option may be the prudent choice.
Disclosure: Morningstar, Inc.'s Investment Management division licenses indexes to financial institutions as the tracking indexes for investable products, such as exchange-traded funds, sponsored by the financial institution. The license fee for such use is paid by the sponsoring financial institution based mainly on the total assets of the investable product. Please click here for a list of investable products that track or have tracked a Morningstar index. Neither Morningstar, Inc. nor its investment management division markets, sells, or makes any representations regarding the advisability of investing in any investable product that tracks a Morningstar index.
/cloudfront-us-east-1.images.arcpublishing.com/morningstar/T2LGZCEHBZBJJPPKHO7Y4EEKSM.png)
/d10o6nnig0wrdw.cloudfront.net/04-18-2024/t_34ccafe52c7c46979f1073e515ef92d4_name_file_960x540_1600_v4_.jpg)
/d10o6nnig0wrdw.cloudfront.net/04-09-2024/t_e87d9a06e6904d6f97765a0784117913_name_file_960x540_1600_v4_.jpg)