
Central Banks Take Center Stage Again
The market may cheer more free money for all, until the reality of Japan's issues gets a second look.
The market may cheer more free money for all, until the reality of Japan's issues gets a second look.

Yet again, central bankers managed to trump business and economic fundamentals. Most major regional equity markets were up close to 3% for the week. Even commodities were slightly higher, up about 0.7%. Meanwhile, U.S. interest rates were up just a smidge, with the 10-year U.S. Treasury bond moving from 2.27% to 2.33%, despite the fact that the Fed announced a complete end to buying additional bond and mortgage securities.
Japan picked up the monetary easing baton on Friday, completely shocking markets. Japan announced a pickup in the level of its bond purchases by about a third, representing a significant expansion. Taking matters more directly into the government's own hands, the Japanese Government Pension Investment Fund announced that it would be shifting more of its purchases to equities in both Japan and around the world. Why wait for lower rates to drive up equity markets and create a wealth effect when it is even easier and more assured if they buy those equities directly? Although the central bank doesn't directly control the central pension fund, the simultaneous moves represent a new chapter in quantitative easing, namely, not just buying bonds, but stocks.
Markets cheered the further bond (and now stock) purchases, but more slow growth and below-plan inflation prompted the move, even before a second increase in the sales tax rate goes into effect next year. The poor demographics and already high debt levels are making it increasingly difficult for Japan to pull out of its slump. It certainly raises concerns about Japan's long-term viability. For today, the market cheered more free money for all, at least until Monday, when the reality of Japan's issues may get a second look.
On the U.S. economics front, pending home sales were OK but not great, home prices continued to moderate, home ownership rates slumped badly, third-quarter GDP growth surprised to the upside while September consumption data looked even weaker than already low forecasts.
The good news is cheap gasoline prices and an ever-expanding savings rate have supplied some powerful rocket fuel for fourth-quarter consumption growth. As powerful as the third-quarter GDP report was on the surface (and as good as the short-term consumption figures may be), the GDP results weren't nearly as good as they looked, fueled by nonsensical net export figures and a short-term surge in government defense-related spending. The report is not an affirmation of 3% growth in the U.S. as far as the eye can see, as many pundits would have you believe. Yes, the U.S. will continue to outdo its developed world partners, but demographics are likely to keep intermediate-term growth in the 2.0%-2.5% range at best. A stronger dollar relative to both the euro and the yen won't help matters, either.
Gross Domestic Product Growth Surprises to the Upside
GDP numbers have been volatile lately, with wild quarter-to-quarter swings driven by inventory and export data. Third-quarter data suggests that the wild swings have been tamped down, at least for now.
The overall growth rate for the third quarter came in at 3.5%, surpassing expectations of 3.1% growth and down modestly from the 4.6% rate of the second quarter. However, both those quarters represent a bounceback from a 2.1% decline in the first quarter. In other words, the recent strength is probably more of a catch-up than a start of a new, higher, sustained growth rate of 3% or more.
My forecast is for growth to drop back modestly to around 3% in the fourth quarter before dropping back to 2.0%-2.5% growth in 2015. Not bad, but not the acceleration that some think is indicated by the third-quarter data. In fact, looking at the more reliable year-over-year data growth instead of annualizing one quarter of change suggests the economy is growing at 2.3%, just about in the middle of 2.0%-2.5% intermediate- and long-term growth potential of the U.S. economy.

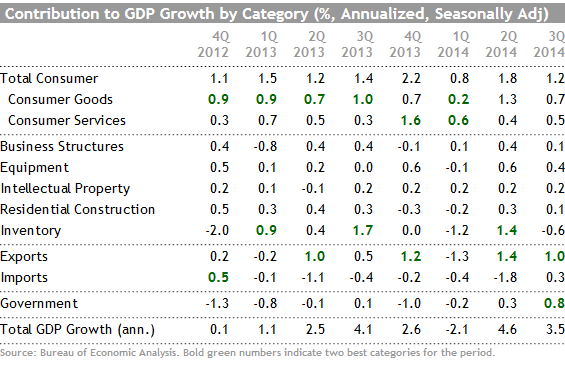
The details of the third-quarter GDP report suggest that the 3.5% growth rate might prove difficult to sustain. First, there was a huge swing in government spending that probably isn't sustainable. After years of declines, the overall government sector grew by 4.6%, contributing a whopping 0.8% to the GDP calculation. Subtract that 0.8% government contribution, which was in no one's forecast, and GDP growth in the quarter would have been a more believable and slightly disappointing 2.7%.
Net exports also looked just a little fishy, contributing 1.3% to the GDP calculation, an event that is nearly unheard of at this stage of the economic recovery. For imports to decline when the U.S. economy is relatively strong (and iPhone shipments began) and for exports to increase when many of our trading partners are weak doesn't seem to make a lot of sense. Unfortunately, government statisticians had to estimate the import/export data for the last month of the quarter, and the government's assumptions looked a little too bullish. And there is potentially a large issue of port congestion that may have temporarily slowed the flow of imports. I think imports are likely to surge in September and October even if they were relatively low in July and August. In any case, there is no way that net exports can provide as big a kick to the economy as they did in the third quarter, creating a relatively nasty headwind.
On the other hand, consumption data looked a little weaker than expected and is likely to rebound in the fourth quarter, perhaps sharply, as I detail later. Inventories were also a bit of a drag in the third quarter, a phenomenon that may reverse itself in the fourth quarter. Housing data didn't add much to GDP as the market remains softer than we had hoped. Business spending looked good, though not quite as good as it was in the second quarter when the data got a weather-related pop. Durable goods order data suggest that businesses will make a similar GDP contribution in the fourth quarter.
Consumption Data Continues to Look Weak
Headline consumption data dropped by 0.2% in September following an unsustainable 0.5% growth rate in August. The number fell below expectations, though weak auto sales and retail sales data released much earlier in the month portended a pretty gloomy report.
Again, I caution that the real way to look at the consumption numbers is to average them over three months, and compare them year over year. I also prefer to look at the numbers after adjusting for inflation. The table below shows that single-month growth rates are volatile and nearly useless--it almost looks like a random walk. Shifting seasonal patterns, weather, changes in tax holidays, and retailer big-event dates continue to drive these numbers wildly in both directions. Not to mention that often massive retail sales report revisions can mean big adjustments to the consumption report a month later. A decent-size revision in the retail sales report for September seems like a real possibility to me. Nevertheless, the year-over-year data takes almost the other extreme (compared with the month-to-month data) with little real variance in the 2.4% growth rate on an inflation-adjusted basis.

Wage and Income Data Continues to Outpace Spending, Continuing to Confound Economists
While headline income growth was modest at 0.2%, it continued to outshine consumption growth yet again, causing the savings rate to move up to a hefty 5.5%. The low consumption rate is particularly curious in light of wage growth, a subcategory of personal income that tends to be the most predictive of spending trends. The current gap in the monthly growth rates in wages and spending is one of the widest I have seen in some time. The trend has persisted long enough that it is apparent in even the year-over-year data, shown below.

Pent-up Demand Is Building for a Strong Fourth-Quarter Performance
I don't mean to sound like a broken record, but given the widening gap between wage and spending growth, I suspect some of that cash will get spent in the near future. My weekly shopping center data and other retail metrics continue to look better than the government's reports. Furthermore, even the consumer sentiment reports (which I normally detest and ignore) are at a seven-year high, which even makes a doubter like me take notice.
Falling energy prices in general and gasoline prices in particular should be a huge aid to consumers in the fourth quarter. Going into the last holiday season (2013) saving rates had moved up and gasoline prices had collapsed over the summer and early fall, similar to the set-up we are seeing in 2014. The results last year were quite remarkable. The growth in the averaged consumption figures jumped above the 2.4% average in the period of October 2013 through January 2014 before slumping as wages and rising gasoline prices, along with freezing cold and snowy weather, slowed consumption early in 2014.
Strong Production Numbers Don't Line Up Well With the Weak Consumption
One part of the economic puzzle that still hasn't dropped into place is that the manufacturing economy has been on a tear--even as the world economy has slowed and U.S. consumption is OK but not much changed from previous growth rates. And at least so far, it doesn't appear to be because of a big buildup in inventories. Business spending and oil-and-gas-related spending may explain some of the mismatch, but the gap still seems a little wide to me. It suggests that even as consumption picks up, the manufacturing data and manufacturing employment may not. Or it may indicate that we have somehow miscalculated either factory growth or retail sales growth or a little of both. Just don't be surprised to see these metrics diverge in the months ahead. No need for worry.
Durable Goods Orders Analysis Depends on Your Time Frame
The headline drop in durable goods orders at a negative 1.2% between August and September looks a little scary to the untrained eye, but a lot of that is driven by falling aircraft orders and auto orders, which are highly volatile. Ex the transportation orders, the durable goods order number was a much less fearsome 0.2% decline. These numbers were, however, slightly below expectations. The year-over-year data paints a very different and much less gloomy outlook, as shown below.

Year-over-year growth in orders in the range of 7% should bode very well for the manufacturing economy in the months ahead as orders eventually drive production, which eventually drives manufacturing employment.
I also like to look at the nondefense capital goods orders excluding aircraft as a real-world gauge of business confidence. They represent just a small portion of the overall durable goods report. Still, it focuses on very expensive goods that are used to manufacture other goods. It represents managements' bets on the long-term future. Like the overall durable goods number excluding transportation, the 7.8% growth rate seems to indicate relatively high management confidence. It is the best reading since spring 2012.

Even in the month-to-month data, all was not horrible. Three of the seven major segments showed improvement, one saw a teeny-tiny decline, and three showed large declines. The metals-related categories and other did well while machinery, computers, and transportation were the losers. Within the transportation category, nondefense aircraft orders were down 16%, continuing their trend of massive volatility. Recall that aircraft orders are next to useless in projecting the trajectory of the U.S. economy. A decadelong backlog at Boeing (BA) means that growth in aircraft production (and its contribution to GDP) and employment will be dependent on Boeing's ability to ramp up and schedule production and not the flow of new orders.
Pending Home Sales Showing a Continuing Positive Trend
Pending home sales showed a very modest 0.3% increase in September to an index reading of 105. That's good, but not great, news for future existing-home sales. For some context: The index ran in the low 120s in the boom times of the early 2000s before dropping into the high 70s in the middle of the housing bust. More recently, the index spiked to 110 a year ago as buyers rushed to close deals before mortgage rates went higher. Immediately before the spike in rates, the index was right around 105, just about where we are now.
That interest-related spike in both existing- and pending home sales appears to be behind us. That quick spike last year merely pulled ahead sales to last summer and then the market suffered a hangover this winter from that big, unsustainable burst. Bad weather further compounded that problem. I would expect more normal growth in both pending and existing-home sales in the year ahead. With lower rates and better employment data, I believe the pending index could grow to 115 by the end of 2015. That should drive up existing-home sales by 5%-10% in 2015 compared with almost no growth in 2014. That would provide a nice help for the economy.

The analysis of the year-over-year data is complicated by last year's spike, but it is still good to see an improving trend in pending home sales, although the year-over-year growth rate is negative. That should flip to a positive over the next couple of months. Also, the gap between pending home sales and existing-home sales growth has finally turned positive, which generally leads to improved existing-home sales.

Home Price Growth Normalizing, Homeownership and Vacancy Rates Trending Lower (Written by Roland Czerniawski)
Tuesday’s S&P/Case-Shiller home price report was the last of the three major price indicators scheduled for release this month, and it confirmed what the two earlier releases, CoreLogic and FHFA, already reported: Home price growth is trending back to its normal and more sustainable level. The Case-Shiller 20-City index, which reports the data on a three-month moving-average basis and includes 20 major U.S. metropolitan areas, showed a 0.6% increase in August. Year over year, the number ticked lower to 6.3%, the lowest level since November 2011. After a long streak of double-digit home price growth that started around March 2013 and extended through the first quarter of 2014, we expect the growth rates to moderate further, back to a more normal level of 4%-5%.

It is a little puzzling that, despite moderating home prices and depressed interest rates, homeownership rates continue to decline. In fact, the U.S. Census Bureau reported this week that the homeownership rate in the United States was at 64.4% in the third quarter, the lowest rate since 1995 and just a percentage point below its historical average of about 65.4%.
At the same time, rental vacancy rates also declined to 7.4%, a level not seen since 1994. The census data shows that the option of renting still remains a preferred alternative among a large number of Americans. It is not surprising that rent prices are going through the roof, and that shelter, the largest component of the CPI, has been one of the top-gaining categories in the past couple of inflation reports. We think that in light of slowing home price growth, relatively low interest rates, fairly low vacancy and homeownership rates, and increasing rent prices this equation might be close to reversing. When that happens, it should provide a vital and much needed boost to the anemic housing market recovery we've seen over the recent quarters.

Next Week Brings Employment, Trade, and Auto Data
All of next week's data is important, but all for slightly different reasons. I am postulating improving consumption data in the fourth quarter, based on higher savings rates and lower gasoline prices. Poor employment data, whether it is the raw growth number, hours worked, or hourly wages, could upset the fourth-quarter holiday party. Nonfarm payrolls were up a healthy if not sustainable 248,000 last month and the economists are expecting a dip to 235,000 to bring growth closer to its recent trends.
Trade is important because it was such a huge contributor to the third quarter. And part of the figure was based on estimates for September. The real trade numbers for September will be out on Tuesday. Pundits are forecasting the deficit will expand from $40.1 billion in August to $41.5 billion in September. Driven by the iPhone and slower oil sales, I believe the deficit will expand by substantially more than the government and other forecasters are predicting.
Auto sales are important because they have been such a key driver of this recovery. The auto sales figures have been on a giant yo-yo lately, some of it because of selling days issues and errant seasonal adjustment factors. Auto sales temporarily spiked this summer to over 17 million units before slumping back to a still-good 16.4 million level in September. That up-and-down action severely complicated the analysis of consumption data and makes the world look more volatile than it is. Forecasts are that October sales should stabilize at 16.4 million units (meaning, at least consumption data won't be hurt in October). I think sales could do even better than that, which could be the best news of the week.
Note: This article has been corrected since original publication. The original text misstated the U.S. Treasury bond yield. U.S. interest rates moved up from 2.27% to 2.33% (not 2.23%) last week.