
Retirement Planning: Think Outside the Pie Chart
Job, home, and Social Security are just as important to retirement as your investment portfolio--and should be part of the plan.
Job, home, and Social Security are just as important to retirement as your investment portfolio--and should be part of the plan.

Note: We're refeaturing this article as part of Morningstar's October 2014 5 Keys to Retirement Investing special report. An earlier version appeared June 22, 2014 and is an excerpt from the working paper "No Portfolio Is an Island" by David Blanchett and Philip Straehl. The full paper is available on Morningstar's corporate website.
"No man is an island," John Donne said. Just as a person's life is part of a bigger picture, so is his or her financial-asset portfolio. An individual's economic worth is made up of more than just the assets held in an investment portfolio.
Other assets, such as human capital, real estate, and pensions (such as Social Security retirement benefits) often represent a significant portion of an individual's total wealth. These assets, however, are often ignored by practitioners when building portfolios, despite the fact that they share common risks with financial assets. In this article, we explore how incorporating human capital, housing wealth, and pensions into a portfolio optimization can help build more efficient portfolios for investors.
We will first describe the different dimensions of wealth, starting with human capital, that make up an investor's total wealth and the risk embedded in them. Based on that analysis, we will then infer how to build optimal portfolios that account for the presence of these other assets.
Human Capital
Human capital has a variety of definitions but can generally be thought of as the total economic value of an individual's set of skills and talents. Human capital is a unique asset, because it varies by age, health, education, occupation, industry, and experience, among other variables, and is nontradable. These traits, in effect, create endowed exposures to certain risk factors that can be difficult to effectively hedge.
The approach we use to estimate the total value of human capital, and its return (i.e., riskiness) is motivated by the work of Ibbotson, Milevsky, Chen, and Zhu (2007) where human capital is the mortality-weighted net present value of wages. The individual is assumed to retire at age 65; mortality is based on the U.S. Society of Actuaries 2000 annuity mortality table for a unisex individual; expected inflation is based on the historical inflation expectations from the Cleveland Federal Reserve; the nominal discount rate is based on the historical yield for different Barclays Investment Grade Industry Bond indexes (yields plus a term premium); and expected wage growth rates are based on changes in employment expectations obtained from the U.S. Bureau of Labor Statistics.
We obtained historical quarterly wage data from the Bureau of Economic Analysis for 10 U.S. industries we selected for the analyses: construction, finance, government, health care, lodging, manufacturing, mining, real estate, transportation, and utilities. The correlations over the past 20 years between the changes in the value of the 10 industry-specific forms of human capital and the returns of 13 asset classes is shown in Exhibit 1 to provide some perspective as to the extent and statistical significance of the relations. The assumed age for the human capital estimates in the exhibit is 45.
(click chart to enlarge)

The correlations are statistically significant for many of the relationships, generally more so for the fixed-income assets than cash, equities, and the alternative asset classes. The average absolute correlation across all asset classes is 0.27 with a median of 0.25. There are some notably high correlations; for example, the correlation between the human capital of the real estate industry and the return on REITs is 0.6. This is an intuitive relationship. It suggests that changes in the value of REITs have a significant and positive relationship with the wages in the real estate industry. The obvious implication is that individuals who work in the real estate industry should likely have a lower (or no) allocation to REITs in their financial assets than individuals who work in other industries, such as manufacturing.
Understanding how portfolio weights should vary based on different asset and risk exposures is the primary goal of this article. While there is potentially only a single efficient frontier for financial assets when ignoring other assets, this efficient frontier becomes far more dynamic (and varying) as different types of individual assets are considered across investors.
Pension Wealth
Pensions represent a significant asset to U.S. households, especially older households. Among elderly Social Security beneficiaries, 53% of married couples and 74% of unmarried people receive 50% or more of their income from Social Security. The value of pension wealth for the purpose of this analysis is defined as the mortality-weighted present value of a person's future Social Security benefits, discounted at the risk-free rate. By considering Social Security retirement benefits separately from human capital, we assume they are independent. This is obviously a simplifying assumption, because pension benefits and human capital are related, especially because Social Security retirement benefits are wage-based. However, the risk factors associated with pension benefits are different than those with human capital, and the relation between human capital and pension benefits will vary by individuals, which supports considering human capital and pension wealth separately.
Housing Wealth
According to the U.S. Census Bureau, home-ownership in the United States was 65.3% as of the third quarter of 2013 and has ranged between 63% and 69% since 1965. A unique risk with housing wealth is leverage. Homes in the United States are generally purchased with some kind of loan, such as a mortgage, with down payments that can be as little as 5%, although a 20% down payment is more common. A 20% down payment implies a five times multiple with respect to how a change in the value of the home will affect the net equity. For example, if an individual owns a home worth $100,000 with a mortgage of $80,000, and the house increases in value by 10% (to $110,000) the return realized by the owner, based on the net equity, is 50% ($10,000/$20,000 = 50%). The amount of leverage is obviously very important for homeowners, because even slight changes in housing values can have a material impact on the net equity of a home, especially for younger investors who may have less equity.
The risk we associated with housing wealth is based on the change in different S&P/Case-Shiller Home Price Indexes for 10 different cities, with data obtained from the Federal Reserve Bank of St. Louis. The 10 cities we selected for the analysis are Atlanta, Charlotte, Cleveland, Washington, D.C., Las Vegas, Miami, Minneapolis, Phoenix, Seattle, and San Francisco. While individual cities were selected to represent different regions, states or other characteristics could just have easily been used. The cities selected were intended to be broadly representative of the United States.
Financial Capital
Finally, financial assets, or financial capital, are the most easily observable and are the most liquid portion of household wealth, and they, therefore, tend to receive the majority of the attention by financial planners when building a portfolio.
The weight of financial assets as part of an investor's total wealth varies by investor type and age. Younger individuals tend to have little financial wealth, but they accumulate financial wealth over their working careers through savings, which is then spent down during retirement. Financial assets are usually the largest in a person's life when retirement commences.
For the purpose of this analysis, financial assets serve as a "completion portfolio," which is optimized considering the other components that make up an investor's total economic wealth such as human capital, housing wealth, and pensions. The objective of the portfolio optimization considered here is to find the combination of financial assets that minimizes the variance in inflation-adjusted change in the total wealth for a given level of return. Traditional optimization techniques define risk as the variance of financial assets, ignoring additional wealth components.
In our optimization, financial assets are represented by the following 13 asset classes: cash; five bond asset classes (U.S. intermediate-term, U.S. long-term, U.S. TIPS, U.S. high-yield bond, and non-U.S.); five equity asset classes (U.S. large growth, U.S. large value, U.S. small growth, U.S. small value, and non-U.S.); and two alternative asset classes (REITs and commodities). We consider the historical returns of the 13 asset classes from the second quarter of 1993 to the first quarter of 2013, for a total of 80 quarters. We selected this opportunity set to reflect asset classes that are commonly used by investment professionals when building portfolios for clients.
Total Wealth Analysis
To demonstrate how the relative weights of these different assets may change over an individual's lifetime, it is illustrative to consider a hypothetical scenario that is representative of an average U.S. household. We assume that at age 25 the individual earns $40,000 a year in after-tax income. Over the individual's lifetime, we assume the real wage growth rate will grow at a constant 1% per year, the annual savings rate is 10%, the discount rate is 8%, and the rate of expected inflation is 3%.
We also assume that the individual purchases a $100,000 home at age 30. The home is purchased with a 10% down payment (that comes from financial capital) with the remainder financed by a 30-year mortgage at an interest rate of 5%. We assume that the real growth rate of the home is 1%. Social Security retirement benefits are assumed to be $20,000 per year, in today's dollars, commencing at age 65. The real discount rate for Social Security retirement benefits is 5%. The relative wealth proportions associated with this scenario are depicted in Exhibit 2.
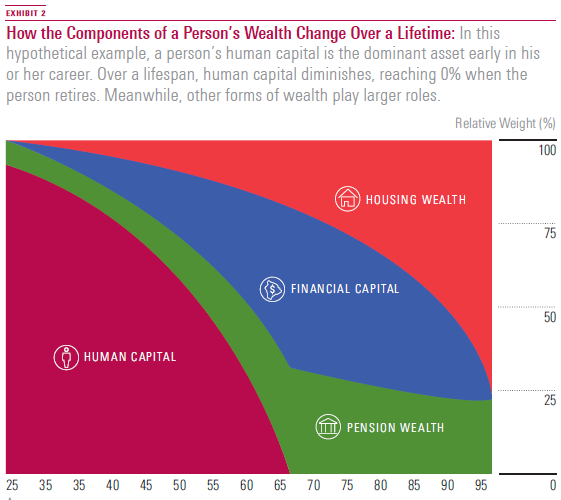
The exhibit highlights a number of general trends over a person's lifecycle. It shows that human capital tends to be the dominant asset for younger households and is transformed into other forms of wealth over a person's lifecycle, reaching 0% when the individual retires at age 65.
Furthermore, the value of pensions increases as the individual ages (as the realization of the benefits comes nearer). Additionally, financial capital is likely to be at its largest at retirement (it follows a hump shape over an individual's lifetime). Finally, the relative value of real estate may increase during an individual's lifetime, and if housing wealth is not used to fund retirement, it potentially becomes the dominant asset later in life.
The scenario considered here demonstrates that even at its peak, financial capital never accounts for more than 50% of the total wealth of the individual. This insight in turn raises the question: How can an asset allocation based entirely on less than half of a client's assets truly be optimal?
Total Wealth Optimizations
To study the impact of including these dimensions of wealth in a portfolio optimization setting, we created 1,000 simulations, representing different combinations of wealth based on job type, location of housing wealth, and age. We call these "total wealth portfolios." For human capital, we consider the human capital associated with the 10 industries mentioned earlier. For housing wealth, we incorporate the housing wealth of the 10 U.S. cities. Finally, we incorporate 10 scenarios, representing different relative proportions of each of the four wealth components based on ages between 30 and 70.
Every possible combination of these simulations leaves us with 1,000 total wealth combinations. The lower number simulations (1-500) reflect potential asset weights for an individual younger than 50, who has higher relative levels of human capital. The higher numbers (501-1,000) reflect potential weights for an individual older than 50, who has higher relative levels of the other three assets, most notably pensions. The age-based scenarios are shown in Exhibit 3.
We placed three constraints on the optimization to reflect common investor considerations as well as to more easily isolate the differences that result from holding different amounts and types of wealth. First, there is no shorting (i.e., all asset-class weights must be positive). Second, the maximum allocation to a single asset class is 20% of the portfolio. This ensures the portfolio must have weights to at least five asset classes. Third, the return of the financial assets (i.e., the portfolio) must be equal to the average quarterly return of all available asset classes over the test period, which was 2.05%. The third constraint is included to ensure the resulting allocations are at least somewhat balanced across both equities and fixed income. Given these three assumptions, the return of each of the financial assets for the optimized portfolios will be identical (within four decimal places); however, the asset-class weights will vary by scenario depending on the riskiness of the other assets (human capital, housing wealth, and pension wealth), and their weights, that are included in the optimization.
The results of the optimizations are shown in Exhibit 4. The chart shows the percentage differences between the optimal portfolio allocations for the 1,000 total wealth simulations and the optimal allocations that ignore human capital, real estate, and pension wealth--what we term the "non-total-wealth portfolio."
Exhibit 4 allows us to identify some important patterns in terms of how incorporating a person's total wealth into the portfolio optimization has an impact on the portfolio weights.
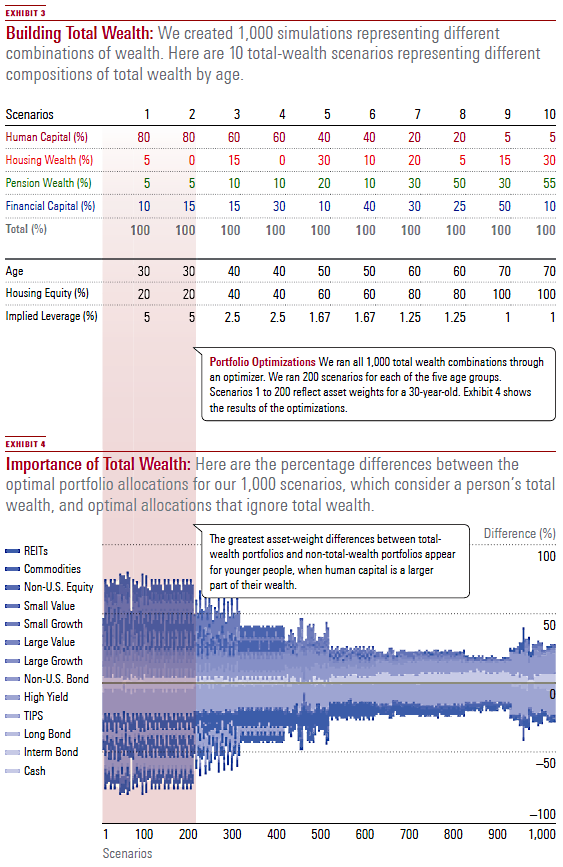
First, the relative dispersion in the optimal asset allocations is clearly more significant for younger individuals with higher levels of industry-specific human capital, with some absolute differences exceeding 75% when compared with the non-total-wealth-optimized portfolios. For simulations 1 to 200, based on scenarios 1 and 2 in Exhibit 3, where the human capital weight is 80%, the average absolute difference versus the non-total-wealth portfolio is 49.9%, while the average difference versus the average overall portfolio is 35.6%. Both of these represent significant differences in the allocations to different asset classes.
Across each of the optimized simulations, when comparing the total-wealth portfolios to the non-total-wealth portfolios, there are lower allocations to long-term bonds, especially high-yield bonds. These reductions are offset with higher allocations primarily to large-growth stocks and commodities. When comparing the total-wealth-optimized portfolios with each other, it is difficult to pinpoint common differences, although allocations to long-term bonds increase in scenarios where pensions are a significant asset (and where the individual is assumed to be older).
Overall, the differences between the optimization routines that incorporate a person's total wealth and the routine that ignores it are material. In other words, ignoring an investor's total-wealth assets leads to portfolio allocations that are inefficient.
Take a Holistic View
In this article, we explored the implications from taking a total-wealth perspective to portfolio optimization. For the analysis, the assets included in the optimization were extended beyond financial assets to include human capital, housing wealth, and pension wealth. The financial assets were treated as a completion portfolio that is optimized to minimize the variance in inflation-adjusted change of the total wealth of an investor. The optimal allocation for an investor's financial assets varies materially based on different total-wealth risk exposures. The differences were the largest for those scenarios where human capital was the dominant asset (i.e., for younger individuals). These results suggest that there is not a single set of portfolio weights for all individuals (or investors), and that allocations should vary based on each individual's unique assets and risks.
This research has important and practical implications for investors, clients, and practitioners. Perhaps most notably, the perspective of an efficient portfolio must be gauged with respect to its risk contribution to an investor's total wealth. For example, financial planners developing portfolios for clients should consider an investor's total wealth when creating portfolios and not focus entirely on the investor's financial assets.
Additionally, plan sponsors interested in building custom target-date portfolios should consider the unique industry-specific human capital, region-specific housing, and other types of risks that make their participant population unique.
Finally, this methodology can be extended to other types of investors, such as charitable endowments, because each investor has risks that extend beyond the portfolio that should be considered in the optimization routine.
This article originally appeared in Morningstar Magazine. To learn more about Morningstar magazine, please visit our corporate website.
* Disclosure
The Morningstar Investment Management group, a unit of Morningstar, Inc., includes Morningstar Associates, LLC, Ibbotson Associates, Inc., and Morningstar Investment Services, Inc., which are registered investment advisors and wholly owned subsidiaries of Morningstar, Inc. All investment advisory services described herein are provided by one or more of the U.S. registered investment advisor subsidiaries. The Morningstar name and logo are registered marks of Morningstar, Inc.
The information, data, analyses, and opinions presented herein do not constitute investment advice; are provided as of the date written and solely for informational purposes only and therefore are not an offer to buy or sell a security; and are not warranted to be correct, complete or accurate. Past performance is not indicative and not a guarantee of future results.