
Where Are the Opportunities in U.S. Health Care?
As the sector has continued to best the broader market, a look both at the dynamics that would drive further outperformance by the sector and at funds that investors can use to tap those themes.
As the sector has continued to best the broader market, a look both at the dynamics that would drive further outperformance by the sector and at funds that investors can use to tap those themes.

Since the start of 2014, the U.S. health-care sector has continued its recent track record of outpacing the broader U.S. equity market, topping the S&P 500 Index by more than 400 basis points. Over the past three years, health-care stocks have in aggregate bested the broad benchmark by 500 to 600 basis points each year.
There are several reasons for the health sector's strong performance over the past few years. Some of it relates to low valuations in 2010 of pharmaceutical stocks--which make up anywhere from 40% to 45% of the sector--as a result of investor fears in advance of U.S. health-care reform and a wave of major patent losses. Ultimately, the drug companies adapted to both headwinds better than expected. In addition, drug companies have enjoyed benefits from a shift in focus that they implemented between seven and 10 years ago after payers decided to reimburse less for slight enhancements to approved drugs, which up to that point had been a big focus of the majority of pipelines. That prompted drugmakers to shift their pipeline focus toward unmet medical needs such as cancer and hepatitis C. Now, those drugs are coming to the market now, and pharmaceutical firms are seeing the fruits of those innovations. That has resulted in an improved growth outlook for drug and biotech firms.
At this time, Morningstar's equity analysts now consider health-care firms to largely meet our analysts' fair value estimates in aggregate. However, even this late into the five-year-plus bull market, we see opportunities for investors both in the broader health-care sector but also within several specific pockets.
Instead, one key theme that we believe that investors should watch closely is the U.S. health-care sector's still-low utilization rates, which have been hampered by a slow-to-recover economy and the time lag between recession and health-care usage, along with a new business model that entails greater cost-sharing with patients. (More favorable volume numbers have begun to appear at hospitals, diagnostic labs, and device firms, both due to the addition of newly insured patients from U.S. health-care reform, as well as from the continued recovery from the recession.) Some other key themes that merit monitoring are the relatively attractively valued pharmacy benefit manager space, ongoing merger and acquisition activity in the biotech subsector, long-term growth in China, which could help drive pharmaceutical and device firms, and corporate inversions, which could reduce drugmakers' tax rates and boost profitability. Exchange-traded funds that can help investors make specific bets on these dynamics include broad funds such as Health Care Select Sector SPDR ETF (XLV), Vanguard Health Care ETF (VHT), and iShares US Healthcare (IYH), as well as targeted ETFs such as iShares US Healthcare Providers (IHF), SPDR S&P Health Care Services ETF (XHS), iShares Nasdaq Biotechnology (IBB), SPDR S&P Biotech ETF (XBI), iShares US Pharmaceuticals (IHE), SPDR S&P Pharmaceuticals ETF (XPH), Market Vectors Pharmaceutical ETF (PPH), iShares US Medical Devices (IHI), and SPDR S&P Health Care Equipment ETF (XHE).
An Overview of Market-Cap-Weighted Health-Care ETFs
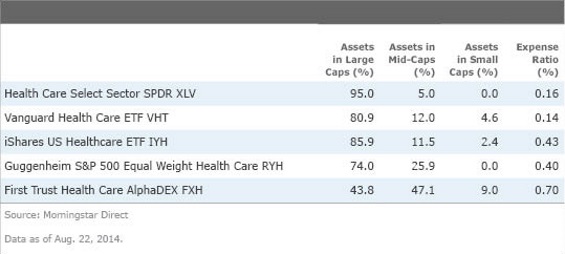
There are three large and liquid cap-weighted health-care ETFs: Health Care Select Sector SPDR, Vanguard Health Care, and iShares US Healthcare. All seek to replicate broad indexes of the largest U.S. health-care stocks, including pharmaceutical companies, biotech firms, health-care providers, health-care equipment makers, and life sciences firms. And all devote between 39% and 40% of assets to pharmaceutical firms, another 20% to 25% to biotech firms and then another 14% to 18% to health-care providers and services firms.
Below are more details on the three funds, as well as two large strategic-beta funds:


PowerShares S&P SmallCap Health Care ETF (PSCH) is another market-cap-weighted ETF devoted to the health-care sector. As its name suggests, PSCH tracks an index of small-cap U.S. health-care companies. It takes its holdings from the S&P SmallCap 600 Index. In the Morningstar Style Box, PSCH falls within the high-growth segment, between micro-cap and small cap. Morningstar does not compute a price/fair value ratio or an Economic Moat Rating for PSCH. The ETF has lagged cap-weighted financial ETFs during the past one- and three-year periods. PSCH's expense ratio is 0.50%.
As we look at still-relatively low utilization rates in the health-care industry--they still aren’t back to where they were in 2007--we think that investors with a bullish view toward increasing utilization rates should consider a broad cap-weighted health-care ETF. Historically, there’s a lag of a couple of years after a recession before health-care spending returns. During this most recent recovery, however, the magnitude of the downturn and increased cost-sharing with patients have conspired to hold back any kind of sharp rebound in health-care use. That said, Morningstar’s equity analysts anticipate gradual increases in demand for health care going forward. For investors seeking to exploit the theme of increased utilization, the two most suitable options are Health Care Select Sector SPDR and Vanguard Health Care ETF.
For investors seeking exposure to health-care firms outside of the U.S., one market-cap-weighted ETF is iShares Global Healthcare (IXJ), which devotes 63% of its assets to U.S. companies. Most of the remaining assets are invested in companies based in developed foreign markets (largely Europe), such as Novartis (NVS), Roche, Sanofi (SNY), GlaxoSmithKline (GSK), and Bayer. Exposure to these names does not offer investors much in the way of added exposure to emerging markets, given that European and U.S. companies sell into the same channels. Performance trends bear this out, as IXJ’s performance is highly correlated with the three large U.S.-only financial-services ETFs (95%-96% during the past five years). And IXJ charges 0.47%, which means that cost-conscious investors looking for financial-services sector exposure might prefer XLV or VHT, which carry expense ratios of 0.16% and 0.14%, respectively.
Strategic-Beta Health-Care ETFs
There are two good-sized ETFs devoted to the health-care sector that seek to improve their return profile relative to traditional market benchmarks. Morningstar terms this category of funds "strategic beta." The first, Guggenheim S&P 500 Equal Weight Health Care ETF (RYH), tracks an equal-weighted index of 54 stocks, which means that smaller health-care firms sit shoulder to shoulder with mega-cap companies. As is the case with other equally weighted funds, RYH offers slightly more of a small- and mid-cap tilt than its market-cap-weighted peers. For example, 25% of RYH's portfolio consists of mid-cap names, compared with just 5% of XLV and 12% of VHT. RYH is only slightly more volatile than its cap-weighted counterparts. RYH has meaningfully outperformed its cap-weighted brethren over the trailing one- and five-year periods and has lagged over the past three-year period. RYH's position in the style box is almost identical to that of VHT; both funds fall between medium and large and are squarely in core growth. RYH also invests in a significant number of high-quality health-care firms, devoting 45% of assets to wide-moat companies, 46% to narrow-moat firms, and just 8% to companies with no economic moat. RYH charges 0.40% and trades at 105% of fair value.
First Trust Health Care AlphaDEX ETF (FXH) tracks a fundamental index that uses a proprietary stock-selection methodology to rank financials firms on both growth and value factors. As a result, FXH's portfolio differs meaningfully from many of its sector-ETF peers. The index rebalances quarterly and takes valuation into account when rebalancing. FXH is closer to the high-growth band in the style box, while the cap-weighted financials ETFs--and RYH--all are a little closer to core growth. FXH's portfolio also has more of a small- and mid-cap tilt than its competitors, with fully 47% of assets invested in mid-cap firms and another 9% devoted to small-cap companies. FXH has meaningfully outperformed the cap-weighted U.S. financials ETFs over one-, three-, and five-year periods, albeit with slightly more volatility than the cap-weighted funds. FXH has a slightly lower tilt toward quality companies than its market-cap-weighted brethren; some 22% of FXH’s assets are invested in wide-moat firms, and another 39% are invested in narrow-moat companies. FXH charges 0.70%. Morningstar's analysts do not cover enough of the firms held in FXH to develop an estimate of fair value.
Subsector-Level Health-Care ETFs
Investors with a strong conviction about an individual subsector within the U.S. health-care sector can consider ETFs devoted to pharmaceutical firms, device firms, biotech companies, and health-care providers and services companies. Some fundamental trends that investors can consider exploiting through a subsector-level ETF are the aging of China (which over the next eight years can be expected to drive significant health-care spending, particularly in drugmakers and med-tech and device firms), continued strength from biotech firms (which are continuing to enjoy rich valuations, significant merger and acquisition activity, a generally attractive regulatory environment, strong sales of already-approved drugs, key drug approvals, and successful integrations of previous acquisitions), a trend toward corporate inversions (which could benefit pharmaceutical firms), and relatively attractive valuations at present of pharmacy benefits managers (which are held in health-care providers and services ETFs).
Outside of cap-weighted ETFs, some of the funds with the highest percentages of companies with economic moats are pharmaceutical ETFs, whose portfolios have anywhere from 49% to 70% of assets devoted to wide-moat firms, and another 21% to 30% of assets invested in narrow-moat companies. Biotech ETFs, which often invest in firms with no approved drugs yet, tend to have lower percentages of assets invested in companies with economic moats (15% to 40% of assets in wide-moat companies, and 30%-35% in narrow-moat firms). Health-care provider ETFs also have lower percentages of assets invested in companies with economic moats.
No subsector ETFs currently trade at below 100% of fair value. In general, pharmaceutical ETFs trade at slightly more attractive valuations than other subsector-level ETFs, as do biotech ETFs.
After assessing the above dynamics, some funds worth considering include the ETFs listed below:

Flow Trends
A look at where fund flows have been going often can help give investors some insight into what other investors are thinking. Recent fund-flow data for health care show several noteworthy dynamics. First, flows have been very strong into the health-care sector over the past year. Over the past year, more than $4.8 billion has flowed into passively managed health-care funds, making it the sector that has attracted the second-most flows in the passive space after real estate. (The story is similar among actively managed funds, where health-care funds have drawn more flows than all but one other sector.) In addition, strategic-beta ETFs devoted to the health industry have enjoyed strong inflows during the past year, owing to their track records of outperformance and a generally increased focus from investors and advisors on strategic-beta funds.


| ETFInvestor Newsletter | ||
 | Want to read more about ETF investing? Subscribe to Morningstar ETFInvestor for fresh ideas for income and total return plus a bird's-eye view of valuations around the globe, portfolio construction advice, and data on the biggest and most popular ETFs. | One-Year Digital Subscription 12 Issues | $189 Premium Members: $179 Easy Checkout |
Disclosure: Morningstar, Inc.’s Investment Management division licenses indexes to financial institutions as the tracking indexes for investable products, such as exchange-traded funds, sponsored by the financial institution. The license fee for such use is paid by the sponsoring financial institution based mainly on the total assets of the investable product. Please click here for a list of investable products that track or have tracked a Morningstar index. Neither Morningstar, Inc. nor its investment management division markets, sells, or makes any representations regarding the advisability of investing in any investable product that tracks a Morningstar index.