
How Long Can the Bull Run Continue?
Quite a while, if past recoveries are any indication.
How Long Can the Bull Run Continue?
Quite a while, if past recoveries are any indication.

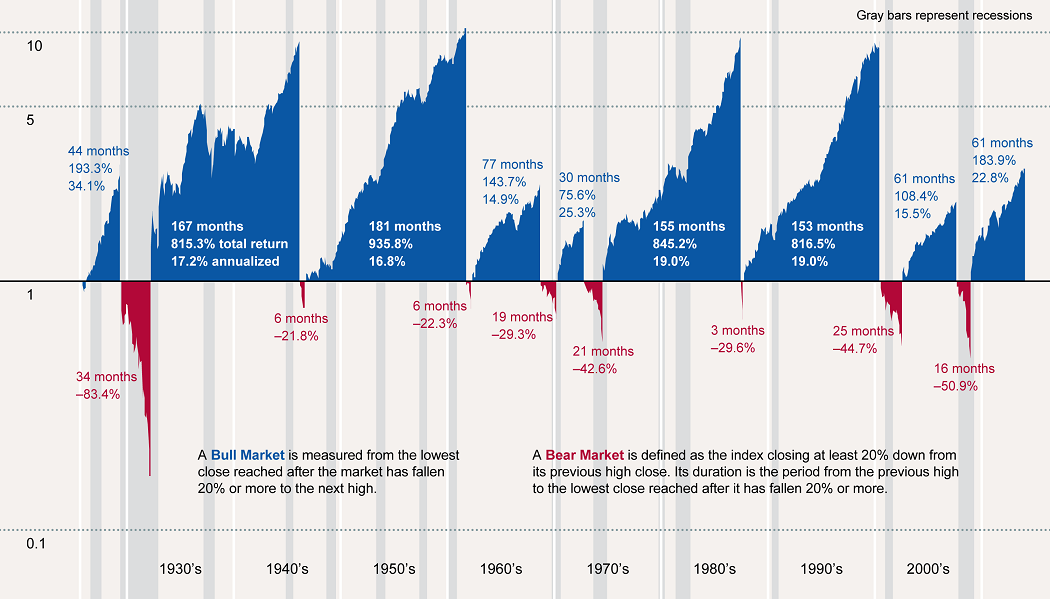
Bob Johnson: This week we're representing a chart that shows the performance of bull and bear markets over time. It's a fascinating graph. It goes all the way back to the Great Depression, and it shows nine, including this one, major recoveries in the market. We get a lot of questions about how long can this bull market in the stock market continue. This graph would tend to stay quite a while.
The graph is neat because it shows the recoveries in two dimensions. First of all, it shows you how long the recovery lasts, and that's by the width of the graph bars that you see there--the wider the bar, the longer the recovery. We can see that some of the recoveries have lasted as long as 168 months. We're only at about the 61 right now. We have got a long ways in terms of time that we can go compared with some of the recoveries. So, we are certainly not necessarily at the end.
Then the other way to measure is by the height: How much in a bull market recovery does the market tend to gain? Now keep in mind, 168 months, we're talking a lot of years. We're talking more than 10 years. And so you would expect a pretty decent return as money compounds. The graph shows that in some periods the market has gone up as much as tenfold during a period of economic growth, and that's really great news.
Right now in this recovery, we're only at about three times the base level. So, I think we've got continued room to grow in the S&P 500 over time. It may not be month to month, but over the long term we still have more room for recovery.