
Forget Fed Tapering--It's All About the Economy
Positive economic news--including Friday’s job report--finally overcame fears about Fed stimulus cutbacks.
Positive economic news--including Friday’s job report--finally overcame fears about Fed stimulus cutbacks.

It took five days, but the market finally realized good economic news for what it really was: a positive for the stock market. The onslaught of positive economic news the last couple of weeks has been relentless, and finally pushed the bears back into the corner. Even fears of an earlier Federal Reserve reduction in bond purchases couldn't stop the bulls on Friday, when a positive jobs report pushed them to victory. The bears were winning for the first four days, but the bulls made up the entire set of daily losses this week in one day--Friday. The S&P 500 closed almost unchanged from last Friday, after declining 1.2% during the first four days of the week.
My reports since April have been relatively cautious, by my standards, as consumer spending failed to show much of an improvement, and income growth was mediocre. Mind you, I never varied from my 2.0%-2.5% GDP growth forecast for 2013, but my bias was nevertheless to the downside. I just didn't seem to see a boom or rapid acceleration. Some of the economic numbers this summer gave even me a good scare.
This week's numbers put a lot of those fears to rest with accelerating purchasing manager data, robust auto sales, improving consumption data, better job growth, and more new-home sales. I could (and do) nitpick several of these reports (GDP and new homes in particular), but it's hard to deny that the economy has gotten back what it lost this summer, and maybe there is even a slight acceleration. I can feel it here at the office--more people buying homes and it's harder to hire new employees. The data still doesn't show anything like a boom, but life is better. Unfortunately, the stock market appears to have figured this out a little sooner than I did.
Quietly Businesses Took the Lead; Now Consumers Need to Kick It Up a Notch
Readers of this column know that I watch consumers like a hawk, because they drive the economy. Businesses hate making the first move and generally don't gear up hiring and production until orders are firmly in hand.
This time around I was wrong. A number of industries, including autos, apparel retailers, homebuilders, and even restaurants stepped up inventories and hiring even if short-term demand didn't fully justify it based on current data. But they all took a shot. This spending has created a modest business-induced stimulus plan that appears to be building and feeding on itself.
For one reason or the other consumers haven't yet fully joined the party--although I believe they will, given a low inflation rate, an improving jobs market, and the potential for a calm budgetary settlement. Income data suggests they have monetary wherewithal to spend more, if only they could feel a little more confident. And I need some of that spending to show up soon, or the economy's big inventory builders will have egg on their faces and will need to cut production.
More Businesses Take a Chance and Build Inventories
Consumer data has been remarkably soft for some time, yet manufacturing and employment data have been quite a bit better. Usually it is strong end-user demand that drives employment and manufacturing, but not this time around.
The mystery of the great disconnect became abundantly clear this week, as data showed inventory buildups and hiring in several key areas in anticipation of better business activity. Almost half of third-quarter growth came from the buildup of inventories, according to the GDP revision released this week.
Earlier in the week, auto industry data revealed a large and ongoing build in inventories. Inventories got far enough above demand that Ford (F) is cutting first-quarter production below year-ago levels. Then The Wall Street Journal wrote a long article on retail apparel stores that let inventories get way out of line. Even the new-home sales report showed inventories 25% above year-ago levels. The restaurant industry went through an inventory build of its own earlier in the year as a land grab for prime locations caused the number of stores and employees to go up dramatically, even as top-line sales remained almost stagnant, at least in the short run.
So, the answer to the question of why consumption and manufacturing data diverged is perfectly clear. What is a lot less certain is whether this is a good thing or a bad thing. More inventories are a good thing if sales were being held back by a lack of goods on the shelf, or if demand was increasing sharply (which isn't the case yet). Higher inventories can also indicate a business's confidence in the future and its forecast of better growth in the near future.
However, high inventories are a bad thing if they get too high and anticipated demand fails to materialize. That means retailers need to flush the inventory, often by using substantial discounts. It also eventually means lower new orders and lower factory production.
The aggregate inventory data don't seem to indicate a large inventory issue that will wreck the recovery. But I think the large inventory build isn't likely to recur in the fourth quarter, making it difficult to reach even 2% GDP growth in 4Q let alone the 3.6% of the third quarter. Full-year inflation-adjusted GDP growth is still likely to come in at the 2.0%-2.5% growth that I had anticipated at the beginning of the year.
Employment Report Consistent With Slow and Steady Growth
The employment report looked good with 203,000 overall jobs added, ahead of expectations of 180,000 jobs and the 200,000 total jobs added last month. The number is also surprisingly consistent with the average job growth of 193,000 jobs added per month over the last 12 months. And it's an awful lot better than the lousy 89,000 jobs added in July that so spooked the market.
That July number is beginning to look like a statistical fluke and not a genuine slowing. That is why I like to use the year-over-year, three-month average data instead of the highly volatile month-to-month series. I also prefer to use the private-sector data, and leave government jobs out of the equation. The year-over-year average private-sector employment growth rate has been stuck at 2.1% for the last four months and hasn't varied much from that rate for the last three years. While I really liked the November numbers, I do caution that it wasn't exactly a barn burner. The report ranks number six out of the last 13 months and was below last November's 256,000 and February's 319,000.

A Lot More to Like Besides the Headline Growth Rate
I have been complaining relatively consistently about the quality of recent job growth, with many jobs coming in the low-paying, low-hour sectors of the economy, including restaurants, hotels, and retail.
This month the goods-producing sector took a big step forward, adding 44,000 jobs versus its 12-month average of 24,000 jobs. The much larger services sector still added 152,000 jobs, but that was well below its 174,000 average over the last 12 months. Within the goods sectors, things were hitting on all cylinders with manufacturing (even including the perpetually suffering nondurable sector), construction, and mining all doing better than trend. Other stronger-than-trend sectors included transportation (couriers gearing up for holiday shipments) and the health and education sectors. Things weren't all roses, though, with finance (which actually lost jobs), leisure and entertainment, and professional services all performing meaningfully below trend.
Hours Worked and Hourly Wages Put More Money in Consumers' Pockets
The category mix of jobs was probably one of the bigger contributors to a better report on both hours worked and hourly wages. However, manufacturing hours were also up, indicating that the improvement wasn't entirely mix-related.
I think the hours and wage data is almost as important as the raw growth in employment, but is often overlooked in quick assessments of the employment report. Although growth in total annual wages paid looks something like 4.4%, just 2.1% comes from adding more employees, and the balance from wage and hour growth per employee. Given very low inflation, those additional wage dollars can go even further. The wage data referenced here is strictly private-sector data, and is not inflation-adjusted.
Consumers Put Some More Money to Work in October
The BEA released both consumption and income data for October on Friday. After months of sluggishness, consumer spending increased 0.3% while incomes showed a small decline after months of massive increases.
I was pleased to see signs that consumers were indeed spending again. I was a bit surprised by the income decline, but suspect that some of the earlier months were a bit overstated. As usual, the year-over-year data provides a clearer picture, with incomes improving at better pace than consumption after months of lagging behind (largely due to the payroll tax increase and the income tax increase early in the year).

GDP Up, but for All the Wrong Reasons
GDP growth for the September quarter was revised up from 2.8% to 3.6%. At 3.6%, this is the third-best quarter of this 17-quarter recovery. It is also above the 3.1% post-World War II average and the consensus estimate of 3.2% growth.
However, almost all of the upward revision was due to a higher estimate of inventories. GDP counts production whether it is sold or whether it is still sitting on the shelves. The 0.8% increase in the estimated GDP contribution from inventory growth combined with the original estimate of a 0.9% contribution means that inventories added 1.7% to the GDP estimate, or almost half of the 3.6% total for the third quarter. Inventories have contributed to GDP growth in all three quarters of 2013, an unusually large stretch at this stage of a recovery. Unless consumption, which grew at lethargic 1.4% rate, accelerates quickly, firms are likely to need to cut production in the fourth quarter to bring inventories and sales into better alignment.
Speaking of consumption, these figures were revised downward in this week's report, which is not good news. Consumption contributed just 1% to GDP growth, down from 1.5% in the first quarter and 1.2% in the second quarter, hardly an encouraging sign. The services part of the economy was particularly disappointing, showing no growth in the third quarter. Even with the slow growth, inventories and consumption combined account for 3.2% of the 3.6% growth in the quarter. Gains in residential and business construction kicked in most of the rest of the growth.
Auto Sales on the Move Again
It is pretty hard to argue with the very positive news out of the auto industry this week. Auto sales for November increased to 16.4 million units (seasonally adjusted annual rate) from a depressed 15.2 million rate in October, the best single-month performance since February 2007. The year-over-year averaged data is a little less dramatic but still indicative of a healthy industry.

I consider auto sales one of my very best indicators of consumer confidence. Cars are big-ticket items that can often be deferred if consumers are feeling glum. Also, demand for cars goes up when job prospects improve. Pickup truck sales are often an indicator of the strength of the construction industry. So the November auto numbers were a welcome relief compared with lackluster retail holiday sales reports. Maybe the consumer isn't feeling so bad after all.
Incentives Helped a Little, and Inventories Are Up More Than They Should Be
It's certainly not the bad old days, but incentives and discounts were up some in November, which helped motivate buyers to act in the days after Thanksgiving. Hopefully, those discounts didn't simply shift some sales from December, historically a very strong month, into November.
Despite Strong Sales, Inventories Remain Elevated
Auto industry inventories have been recovering from recession lows for some time. Inventories that are typically in the 60-80-day range have now crept up to the 90-day or so level. Approaching the issue another way, domestic auto sales are at about 88% of their 2005 high, while production is at a spectacular 97% of its highs. Production has basically returned to normal, but sales aren't improving quite as quickly. This is at least partially why Ford will shut down some production in the fourth quarter and reduced first-quarter production below year-ago levels.
Purchasing Managers' Surveys Point to a Stronger Manufacturing Sector; I Am Less Sure
The ISM version of the monthly purchasing managers' report boomed ahead to its highest level since early 2011. The index has been on a rampage the last six months, moving from 49.0 to 57.3 in almost a straight line. The November reading exceeded the consensus of 55.0, and October's reading of 56.4.
Fifteen of 18 categories were in growth mode. Only apparel, wood products, and machinery showed contraction. The most forward-looking component of the index, new orders, was even stronger, growing from 60.6 to 63.6. More concurrent indicators, including employment and current production, were almost as strong and improving. Qualitative assessments were even more bullish, with many respondents indicating that they are seeing improvement even during a time of year when activity begins to drop.
However, actual gains in manufacturing production have been stunningly slow in the face of that growth. Year-over-year production growth was slightly higher a year ago when the index was a mere 49 and falling. I am hoping that the PMI turns out to be a very early leading indicator this time around and that actual production begins to pick up. One nagging concern remains: consumer spending isn't even moving as fast as slow production growth, which doesn't bode well for production increases in the near term.

Great New-Home Sales Data Is a Mirage
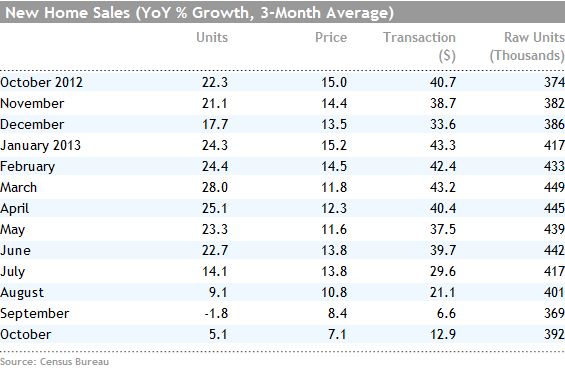
New-home sales (which measures single family home sales excluding custom home and builder occupied homes) jumped a seemingly strong 25% in October compared to September. However, that was because sales in September were down sharply, and August sales figures were revised sharply downward. Sales of 444,000 homes for October were above the nine-month average of 420,000, but not by a lot. Sales in September were an embarrassing 354,000, the lowest level since early 2012.
Because of the government shutdown, both the September and October reports were released together this week. A lot of media outlooks focused on the October report, figuring that September was previously reported. Combining the two reports, it looks the market for new homes isn't improving all that much. January sales of 458,000 topped the October report as did several other reports this year. Year-over-year, averaged data paints a picture of a housing market that is rapidly losing momentum.
Home Inventories Moving Up, Which Could Be Good or Bad
New-home inventories have been growing at a relatively strong and steady rate over the last year, moving from a low of 146,000 homes a year ago to 190,000 in September before backing off slightly in October to 183,000 units. Still, inventories are up 25% from a year ago while sales are up 22%.
Realtors have been claiming for some time that a lack of attractive, well-priced inventories has been holding back the housing market, so more inventory might not be a bad thing. Fortunately, a lot of the inventory increase is in homes not started (versus homes already under construction or finished on a lot), so this inventory increase has yet to turn up in housing starts or construction employment. The bad news is that higher inventories might mean less interest on the part of buyers and that real buyers aren't nearly as optimistic as builders. The true interpretation probably lies somewhere in the middle of these two extremes, with a slight bias toward the positive interpretation.
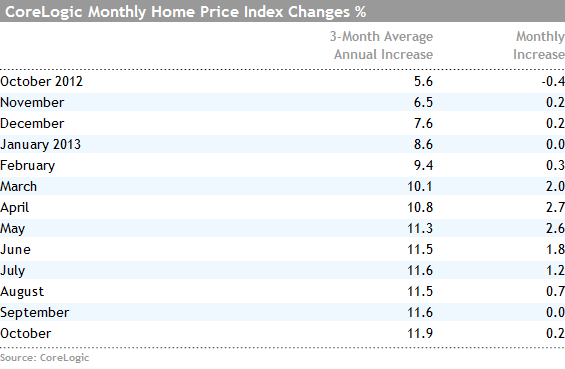
Home Price Growth Continues to Moderate
On a single-month basis, nonseasonally adjusted home prices were up 0.2% from September to October and are up 12.2% year over year, according to the latest CoreLogic report. Home price appreciation has clearly slowed to a more sustainable level. That deceleration is even evident in the slower-to-act three-month moving average, as shown below.
Appreciation continues to vary widely by location, with hard-hit Western states doing particularly well and states in the Deep South showing almost no gains. However, there was at least a little shifting in the pattern as both Georgia and Michigan are in the top five in terms of price appreciation. Some of the booming Western states are now seeing somewhat slower growth than in the last few months.
Home prices are still about 17% below the previous peak reached in April 2006; however, the report noted that prices were within 10% of their peaks in 23 states, similar to last month's report. Some states, including Texas, Colorado, Vermont, Iowa, Nebraska, and North Dakota, were all within 1% of previous highs. Still, some states are in the doghouse. Nevada is still 41% below its previous peak, and Florida and Arizona aren't far behind at 37% and 32%, respectively.
Looking ahead a little, CoreLogic's study of pending (not closed) sales suggests that there was no price appreciation at all between October and November. Nevertheless, year-over-year growth in November is likely to remain above 12%.
Imports and Exports Both Improving, Indicating an Improving World Economy
Looking at the data on a year-over-year averaged basis, growth in both exports and imports increased in October. Increased exports are great news for the U.S. economy, especially the manufacturing economy. Although I don't usually get too excited by higher imports (they actually detract from U.S. growth), it is yet another indicator of businesses anticipating a stronger U.S. consumer. It also is good news for our import partners that will benefit more from increased shipments to the United States. While both imports and exports improved nicely, the gap between exports and imports widened in October, in favor of more exports.

Retail Sales Report Dominates Next Week's Economic Data Releases
After an action-packed week, next week should provide a little rest for the economically weary. The retail sales report is due next week, which should shed some light on consumer spending for November. I am looking forward to the report, as the holiday sales reports so far have been on the disappointing side, with sales from Thanksgiving until Sunday showing a small year-over-year decline. However, those reports miss some industries and don't include all of the online sales data.
The report due next week should provide a clearer picture because it includes a full month's worth of data, not just one part of one week, and it includes both brick-and-mortar sales, and sales conventional retailers make online as well, as a separate category for e-retailers. The one drawback I see in this report is that the Sunday after Thanksgiving will not be included in this year's report, but will be included in the year-ago data. The October data was quite strong and came as a large surprise. Therefore, analysts are expecting a slight decline in the overall sales rate from 0.4% in October to 0.3% in November. Growth over 0.5% or so would be very bullish for the consumer and for the economy, representing a real game-changer. However, year-over-year growth ex-auto and gasoline are likely to remain in the 4% range as they have for the last year.
The other reason I will be watching the report closely is that businesses have been seemingly more bullish than consumers for several months, as shown by inventory data. Select businesses, especially autos, clothing retailers, and restaurants, have been quite aggressive in hiring and inventory increases. A strong retail sales report would justify those increases and spell truly good economic activity in the months ahead, while a decline might indicate a need to trim production. I am watching this one closely--very closely.
The Federal Budget deficit is also due next year, along with the Producer Price Index. The budget deficit should show continued improvement from year-ago levels as higher tax collections continue while spending is restrained. Very aggressive budget-cutting in fiscal year 2013 was a major detriment to economic growth in 2013. The Producer Price increase is expected to show minimal 0.1% growth, which should help keep the more important Consumer Price Index in check the following week.