
Economy Not Up to Fed's Expectations
Increased Fed economic forecasts of just last week already look embarrassingly high.
Increased Fed economic forecasts of just last week already look embarrassingly high.

It was another volatile week for the Dow and the S&P 500, with Monday and Friday showing meaningful down drafts related to the Fed possibly starting to taper bond purchases as early as September. Meanwhile, China worries about tighter credit, falling purchasing managers reports, and the slowing growth rate didn't help matters, either, especially on Monday. (Later in the week it looked like China's central bank was backing away from its laissez-faire stance toward the most recent liquidity crisis, especially after a 5% stock market decline.)
In between the two big Fed-related days, some of the economic indicators, especially first-quarter GDP growth, came in slower than expected, prompting hopes that just maybe the Fed wouldn't be tapering after all. At a minimum, increased Fed economic forecasts of just last week already look embarrassingly high.
The weekly shopping center data also continued to show sluggish consumer spending. Maybe that was because consumers were busy desperately trying to rush through mortgage applications to beat rate hikes, purchasing new homes and new cars. No joke--regular spending often takes a short-term hit in months that auto and housing do well. Still, the largest determinant of GDP growth--year-over-year consumption growth (calculated on services in addition to goods bought in shopping centers)--remained firmly planted at just under 2% year-over-year growth in May, not showing signs of accelerating or declining.
On the other hand, the real estate indicators seemed to be showing signs of acceleration. Also in the good camp this week was the initial unemployment claims report, which dropped back again, leaving the longer-term trend almost unchanged. Then, when things seemed just about settled, another Fed governor spoke on Friday, indicating that tapering was still very much on the table, even after some of this week's relatively soft data. If I didn't know better, I would swear the governors are intentionally trying to keep the bond traders off-guard by alternating the speaking dates of hawkish and dovish governors. (Just a tip for short-term traders only, check the Federal Reserve website to obtain copies of speeches and delivery dates.)
To me it still looks like the United States is on the road to continued sluggish 2% growth, inflation is likely to remain well below 2%, and long-term interest and mortgage rates are destined to go higher. When, not if, is the correct question to ask relative to interest rates. That's not to say we won't see a little bit more easing in between if the sluggishness I am anticipating continues too long for the more optimistic Federal Reserve.
Third GDP Downward Revision Takes the Market by Surprise, Driving Interest Rates Down
Wall Street absolutely loved the unusually large downward GDP revision on the third and final reading for the first quarter of 2013 because it potentially meant that markets would get a reprieve from the Fed's tapering program that could have begun as early as September.
With the first-quarter GDP growth rate now locked in at 1.8% and the second quarter likely to be even lower at 1.5%, it's going to be darn hard to reach the Fed's forecast of 2.3%-2.6% for the full year. The U.S. economy would have to grow at something like 3% in the second half. Possible, but not probable. However, keep in mind the Fed has stated it is watching unemployment and inflation, not GDP growth, as its policy guide.
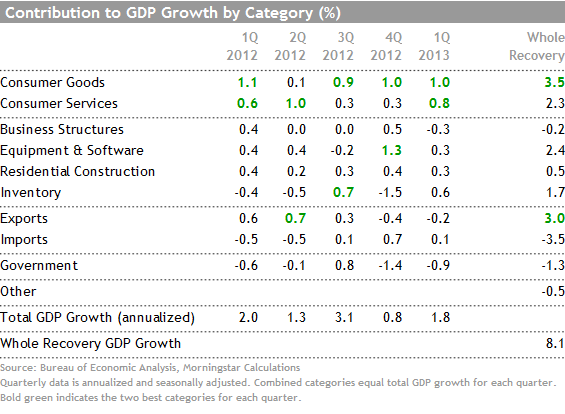
Contribution from Consumer Services the Primary Factor in Reduced GDP
The revision itself wasn't exactly great news for the economy. Few categories changed that much in this revision. Though consumer spending on services took a huge hit, declining from a 1.4% contribution to GDP growth to a more meager 0.8%, as estimates of restaurant and travel spending were reduced. The original consumer services number looked suspicious because it was so much higher than trend and was drastically better than spending on goods. However, most economists assumed that the services number was pretty well locked in by the second GDP reading, and it seldom moves much by the time we receive the third reading.
When All Is Said and Done, Consumers Still Drove First-Quarter Results
The No. 1 and No. 2 contributors to the 1.8% growth rate were consumer goods and services, respectively. The private sector grew about 2.8%, a respectable growth rate, while government took off close to 1%, a shockingly large number for a sector that is almost always good for at least a small contribution. Net exports were a small detractor, while inventory growth provided a meaningful contribution. Housing was helpful, adding 0.3% to GDP, but still not really big enough to move the needle. Unfortunately, declining business spending on structures exactly wiped out the gains in residential construction. In summary, the U.S. economy has become a one-trick pony, with consumers providing the only meaningful source of growth in the recent quarter.
Personal Income and Expenditure Report Demonstrates How Hard It Will Be for the Economy to Accelerate
Despite some relatively large changes in the GDP report, the personal consumption report showed spending locked in its same tight range, with income growth improving but trailing way behind spending growth. Consumers are clearly spending some of their stock market and housing gains as well as special dividend and bonus payments made at year-end to make up some of the difference. Surprisingly little, if any, of the gain comes from increased overall consumer borrowing, which declined during the first quarter of 2013.

The income growth data has fallen off sharply recently primarily because of the 2% increase in the payroll tax (which reduces income growth by 1%) implemented in January. (It shows up slowly in the table above because of my three-month moving average methodology.) So without the payroll tax increases, income growth would look halfway decent. The pretax wage data above demonstrates that trend. Alas, consumers can only spend aftertax income, not pretax earnings.
Regrettably, income growth is likely to keep a lid on consumption growth, which in turn will keep GDP in check. Without lower prices or more exports, it will be unlikely that GDP growth can accelerate a lot from here. On the other hand, rock-solid consumption trends, combined with the ability to tap gains and loans to maintain spending in the face of sluggish income growth, will also put a solid floor under my 2.0%-2.25% GDP growth forecast.
Real Estate Market Accelerating Again
The real estate news this week was remarkably good across the board with improved news on home prices, new home sales, and the most important, pending home sales. Whether the improved data is due to a late-arriving spring, a mad dash to beat higher mortgage rates, or a fundamental housing market improvement is too hard a call to make without a few more months of data. That said, I continue to believe the housing market has years of improvement in front of it, but tight credit and inventories will likely limit the potential for sharply accelerating rates of improvement.
Case-Shiller Home Price Index Still Accelerating
The Case-Shiller news was as good as I had expected based on the strong CoreLogic data released earlier this month. The slower-moving and less volatile FHFA data also showed improvement, though perhaps not as great as in earlier months.
Both reports showed wide variation by region, stretching from no growth to more than 20% growth. Both reports have shown an improvement in every market for several months. Just as a reminder, private equity purchases of homes in a relatively select number of markets are causing these home price increases to look just a little better than they actually are.
The Case-Shiller numbers are now up 13% off of their lows reached in early 2012, though still 25% below 2006 highs. On average, homes purchased after late 2008 and before early 2004 are now selling above their purchase prices, leaving a fairly narrow five-year band of houses that are still selling below the purchase price.

I think slowly increasing inventories and slightly higher mortgage rates could begin to slow some of the rapid improvement we have seen in recent months, as the FHFA index already has. The FHFA improvement in growth rate was the smallest since September.
Pending Home Sales on the Right Track at Last
From October through April pending home sales had been sluggish, affected by both weather and lack of inventories in addition to continued mortgage banking stinginess. With weather slightly better and inventories improved, pending home sales have broken their pattern of slowing growth rates, which have now turned into accelerating growth rates. After growth rates declined from more than 13% to less than 8%, pending sales growth is approaching 10% again.

Pending home sales tend to lead the more closely watched existing home sales report. Furthermore, a shrinking negative gap between pending sales and existing home sales tends to foreshadow an increasing existing home sales growth rate. The improved existing home sales we have seen thus far, plus the expansion implied by the pending home sales data, suggest that existing home sales (particularly the commissions they generate) will be a far bigger contributor to GDP growth in the second quarter compared with the first quarter, representing one of the few categories that has potential to improve in the second quarter.
New Home Sales Jump on the Sale of Homes Bought But Not Yet Started
New home sales have been moving up sharply in the last couple of reports. For the month-to-month folks, the numbers never look all that dramatic because the U.S. Census Bureau keeps making massive adjustments to earlier months. However, on a year-over-year basis, new home sales jumped from 369,000 to 476,000.
The year-over-year new home sales data looks relatively similar to the housing starts for single-family homes report, but the pattern is different. Single-family starts growth is decelerating and new home sales are accelerating. For now, it's a divergence worth keeping an eye on.
The single-family starts report includes custom homes and builder-lived-in homes, while they are excluded from the new home report. On the other hand, the new home report includes homes sold that were built and sitting in a development lot for a while and homes that haven't even been started. Indeed, not-started new home sales nearly doubled from a year ago. Also worth noticing is a massive 76% jump in Midwestern sales, which is probably weather-related and distorting the data to the upside this month.

Employment Report Front and Center Next Week
The Federal Reserve is primarily using two economic statistics to guide its economic policy decisions: the unemployment rate and inflation. Therefore, even though the unemployment rate is a badly lagging economic statistic, it has now taken on a life of its own. That's especially true because the inflation rate is benign and likely to remain so in the months ahead. For some perspective, the unemployment rate peaked at 10.0% in October 2009 (four months after the recovery officially began) and has fallen in almost a straight line to 7.6%. If the rate continues to fall at that same pace, the rate would drop to roughly 7% by next April and the Fed's magic 6.5% level nine months after that, or roughly the beginning of 2015.
Of course, that assumes the economy and employment continue to move at their respective paces. I have conjectured that a diminished participation rate--a result of accelerating baby boomer retirements--could potentially move up that timetable. My current forecast is that the unemployment rate hits 7% as early as December, about four months earlier than my handy dandy ruler suggests. Again, that's not because of a booming economy but a lower participation rate, which isn't entirely good news. For June, I am expecting only a small improvement in the unemployment rate, to 7.5%.
As a single point, I suspect the economy added about 160,000 jobs in June, off slightly from the 175,000 May pace and the 12-month average of about 180,000 jobs. That equates to an overall annual percentage gain of about 1.6% and private sector growth of about 1.9% (the government sector is actually shrinking). Given announced GDP growth of 1.8% in the first quarter and my forecast of 1.5% for the second quarter, it would be quite hard for the economy to have total job growth of any more than 1.6%. It's really difficult if not impossible for jobs to grow faster than GDP. Employers are unlikely to hire workers at a faster pace than they are producing goods.
Auto Sales Will Give a Good Read of Consumer Confidence
Auto sales are one of the markers for consumer confidence (with due respect to the Federal Reserve, which prefers the nearly useless University of Michigan survey). Auto sales dipped under 15 million units in April, rebounded to 15.3 million units in May, and are expected to jump to a recovery high of 15.5 million to 15.7 million units in June. Auto sales have been in a rut since last December, but the June report has the potential to be a breakout event.
ISM Manufacturing Report Not Likely to Add Much Value
With export sales weak, I am not expecting any great news from the ISM and manufacturing. However, given the pickup in autos and Boeing (BA) pushing ahead, I suspect that the June number is likely to increase to 50 or more, up from May's surprisingly disappointing 49.0 reading. Even if the metric were to drop a little, I wouldn't panic unless the metric dropped below 43. In fact, the metric fell to below 40 three times in the 1990s without triggering a recession. I do warn that the markets react sharply to the metric, although I view it as largely irrelevant. (The market loves this metric, because it was one of the few to call the end of the recession.)
Trade Balance Expected to Remain Flat
The trade deficit has remained surprisingly tame recently and is expected to remain virtually unchanged again for May compared with April at $40.2 billion. If the forecasts are correct, the trade deficit will be down an impressive 12% from a year ago. The revived U.S. oil and gas industry is behind most, but not all, of the dramatic improvement. The report always catches a little attention because it will provide a pretty good clue as to whether net exports will be a help or a hindrance to second-quarter GDP. With consumer spending growth likely to slow from the first quarter, a little help from exports would be a welcome upside surprise. The most likely case is for net exports to be a small detractor from GDP growth compared with the first quarter.
Construction Report Could Provide Some Clues to GDP Growth
Private nonresidential construction was a relatively large detractor from GDP in the first quarter. The May construction report from the U.S. Census Bureau will provide some clues as to whether the general softness will continue into the second quarter. The overall April data was up 0.4%, and the consensus is expecting an even bigger 0.8% rate for May. That would be great news for the economy and the GDP calculation. The private business construction sector took 0.3% off of the first-quarter GDP calculation. In fact, business spending on structures exactly offset all of the improvement in the residential sector that everyone has been crowing about.