
Our Outlook for the Market
The market looks increasingly dear, but bargains can still be had.
The market looks increasingly dear, but bargains can still be had.

The market looks increasingly dear to us today, after rising roughly 5% since our last quarterly review. That increase has run a little ahead of the mixed, but generally upward revisions to our earnings projections and fair value estimates. However, we still see attractive values in individual industries and firms and, in particular, among wide-moat companies. That's the basic message in our latest quarterly review.
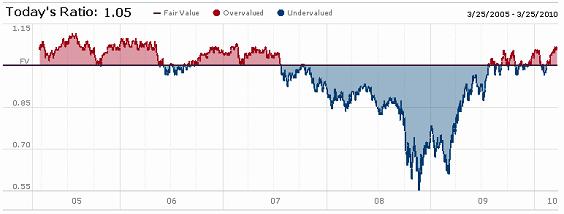
Morningstar equity analysts cover about 1,700 companies, and we develop sector and overall market outlooks on a quarterly basis. One way to get a read on our collective take is with Morningstar.com's market fair value graph. This tool tracks the median price/fair value ratio of our coverage universe over time and allows you to drill down to see our assessments across moat, uncertainty, sector, and industry categories. You can couple that with our in-depth sector discussions below, which include a review of the individual stocks our equity research teams have identified as some of the best values in the market right now.
At the date of our last quarterly review, in December 2009, the median price/fair value ratio for our overall coverage universe was 1.02. Today, that ratio is up to 1.05. It has basically been fluctuating around 1.0 since late 2009, after the significant market rally that began about a year ago.
The median price/fair value estimate ratio increased in the last quarter in all three of our economic moat rating categories, but we still see greater opportunity in the smaller, wide-moat category. This category includes those firms we deem as possessing significant competitive advantages and the potential for superior returns on capital. The median price-fair value ratio for these 160 companies is at 0.96, below the median ratios for the narrow (1.01) as well as no-moat (1.14) buckets.
We still don't have much in the way of sector-wide calls right now, at least at the higher levels of aggregation. Our health-care team was relatively bullish last quarter, but even there, we are seeing fewer attractive values these days.
| Median Price/Fair Value Ratios | |
| Business Services | 1.00 |
| Consumer Goods | 1.07 |
| Consumer Services | 1.11 |
| Energy | 1.02 |
| Financial Services | 1.03 |
| Hardware | 1.17 |
| Health Care | 0.98 |
| Industrial Materials | 1.08 |
| Media | 1.08 |
| Software | 1.17 |
| Telecom | 0.99 |
| Utilities | 1.04 |
 | |
| All | 1.05 |
| |
| Data as of 03-25-09 |
Our market valuation graph allows you to poke around in all the industry groups underlying these sectors, supplementing our sector discussions (including our best individual stock ideas) below.
For example, our "industrials" category includes firms we identify in the "general building materials" and "residential construction" categories. Hammered in the recession, stocks in these groups have been relatively dormant amid a developing economic recovery. We have yet to see a significant housing recovery, to be sure, but the price/fair value ratios in those industry groups are among the lowest in our coverage universe right now.
A notable industry at the pricey end of the scale is staffing and outsourcing services, where stock prices have had a significant run in recent months. If that market reaction augurs well for stronger labor markets, a better housing recovery could be on the cusp as well, supporting our take on housing-related stocks.
You can learn more about the opportunities, trends, risks, and performance drivers identified by our analyst research groups in the articles listed below:
Our Outlook for Basic Materials Stocks
Our Outlook for Business & Financial Services Stocks
Our Outlook for Consumer Stocks
Our Outlook for Health-Care Stocks
Our Outlook for Industrials Stocks
Our Outlook for Tech & Telecom Stocks
Our Outlook for Utilities Stocks