
Has Job Growth Peaked?
Lurking behind the stable, more predictable employment numbers is an undeniably sharp decline in monthly job growth rates.

Markets all acted a little sickly this week, with the S&P 500 declining for nine straight days, although none of the declines was major.
The cover story is U.S. election worries that intensified dramatically, and Donald Trump is closing his gap with Hillary Clinton in polls released this week. U.S. Federal Reserve musings about a December rate hike at its most recent meeting didn't help, either.
We think these issues might be real, but more likely the economy continues to look softer to us. Although the Street was pleased with headline employment data, the same data, if released just a few months ago, would have sent markets into a tizzy. Economists are adjusting to lower growth potential, although we believe markets are not.
Employment Growth Rate Declines Begin to Slow The October employment report sent a lot of weak, mixed messages. Total employment growth of 161,000 jobs added was modestly below expectations, but previous months were revised higher by 44,000 jobs. We note that the number was particularly disappointing compared with the 295,000 jobs added a year ago in October.
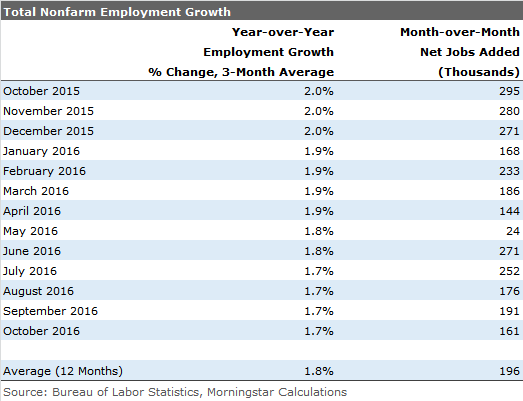
Hours worked were flat month to month but still down year over year and likely to face more year-over-year headwinds in the upcoming months. Hourly wages also got another big bump month to month. On a year-over-year single-month basis, growth was 2.8%, the highest level of the recovery, and a still-healthy 2.66% on a three-month averaged basis. Last year that number was 2.4% in October.
However, all-in inflation was 0.1% a year ago and is likely to check in at 1.4% for this October, so that wage increase isn't as beneficial to consumers as many believe. On the other hand, the high headline wage growth rate will give the Fed's inflation hawks more ammunition to push for a December rate increase.
Raw Employment Growth Numbers Have Slowed a Fair Amount, and Nobody Seems Worried I think most economists are very pleased that month-to-month employment growth numbers have stabilized, and we have gone several months in a row without a spike in either direction.
However, lurking behind the stable, more predictable numbers is the undeniable fact that there has been a sharp decline in monthly job growth rates. Just over a year ago, a jobs report showing growth of under 200,000 jobs was a reason for sell-off. During calendar 2014 and 2015, 240,000 jobs per month on average were added. Now with three months in a row of mid-100,000 jobs growth, everyone seems happy. Still, the prospect for a quick return to those days of heady growth is not likely, given slow GDP growth rates and demographics.
Whether the recent slowdown is a result of not enough qualified workers or not enough jobs to go around is still an open question. But with job openings still high and lay-offs or firings of any kind almost nonexistent, one cannot deny that a lack of workers is indeed part of the problem. However, whatever the cause, slower employment growth is not good news for consumption, which is the key driver of GDP growth and for the housing industry, which is highly dependent on employment growth to sell more units.
Has Job Growth for This Cycle Peaked? The slowing in job growth has been more visible, and started much sooner in the year-over-year, averaged data. That is true for both nonfarm payrolls, which include government and private-sector workers, as shown in the graph below.
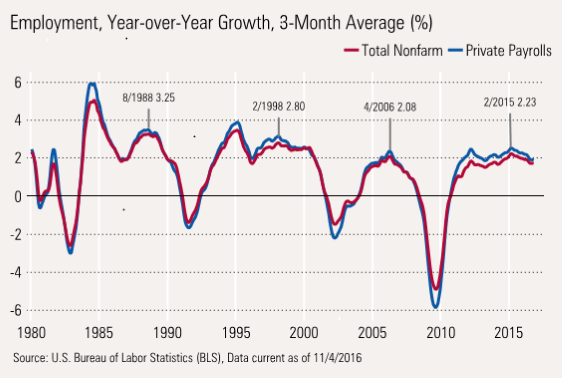
Growth for the recovery, excluding the usual post-recession bounce, appears to have peaked way back in February 2015 at 2.23%, and has subsequently dropped to 1.71%. There are two interesting things to note in the chart below. First, the recovery has been less robust than most recoveries (although better than 2006 peak). Second, the recovery has lasted longer.
Employment Growth Only Part of the Total Wage Picture We have frequently noted that the employment growth metric is just one part of the job market and wage story. Number of hours worked and hourly wage growth also determine total take-home wages that ultimately drive the key consumption metric. The table below shows the private sector growth rates for all three components plus a total (we don't include the government, because it doesn't report hours data).
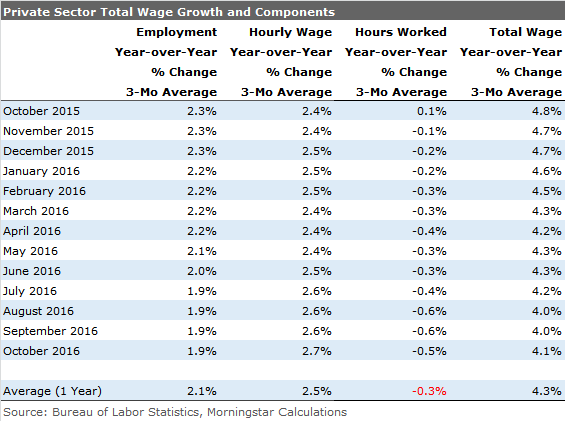
The year-over-year nonfarm payroll data job growth rate has slowed meaningfully, from 2.3% a year ago to just 1.9% now. Just about offsetting that is hourly wage growth, which has improved from 2.4% to 2.7%. However, almost never discussed is that hours worked are slowing, too. You can blame economists for the oversight, because the number ticks up and down irregularly in seemingly tiny increments of 0.1 hours. However, a one tenth move in hours amounts to 340,000 jobs in a year or 28,000 jobs in a month, which is nothing to sneeze at in our new, lower-growth world.
Rolling all three metrics together, shown in the last column, total wages have fallen from 4.8% to 4.1%, which is still a meaningful decline, but not the end of the story
Increased Inflation Puts a Damper on Wage Increases
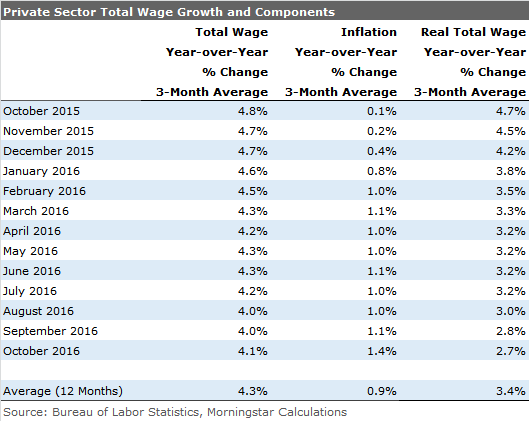
We have transferred the nominal wage growth we calculated earlier to the first column of the table above. Next we subtract out the impact of inflation. Inflation is shown in the second column, and the final result is in the last column.
Slower Wage Growth, not Election Uncertainty, Brexit Worries, or Weather, Is Slowing Consumption That is where things get a little scary. Over the past year, headline inflation has risen from just 0.1% to 1.4% as energy deflation diminished substantially. That means inflation-adjusted wage growth has fallen from 4.7% to just 2.7%, which will put a new lid on consumption. We don't believe that inflation is done going up and is likely to exceed 2% sometime early next year. That is likely to put wage growth, adjusted for inflation, into the low 2% range.
GDP Data, While Stabilizing, Suggest That Employment Data Won't Come Bounding Back The relationship between total hours worked and GDP growth has been an exceptionally tight one. In most normal recoveries, GDP growth is modestly higher than hours worked growth, and there can be no doubt that GDP growth leads hours and not vice versa.
The red line (GDP), in the graph below, always moves before the blue line (hours) even when viewed on a long-term chart. We have found that using rolling 12-month data to reduce weather anomalies and using hours, instead of just the number of jobs added, provides much a clearer picture of the relationship between GDP and the health of the employment market. Using just employment data misses the fact that businesses often reduce hours before they engage in layoffs or other job actions.
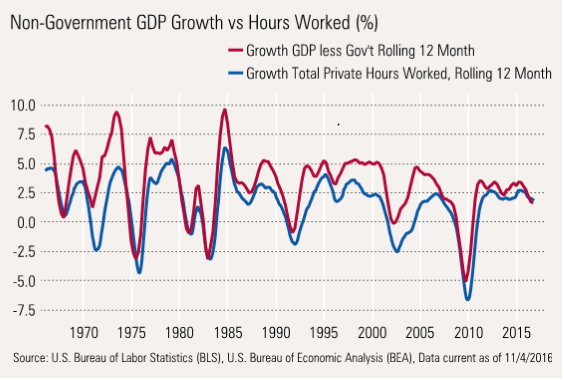
At the moment, GDP growth is still moving down and is about 1.6%, and hours are growing at 1.8%. Usually, GDP growth runs above hours growth (productivity) except during recessions.
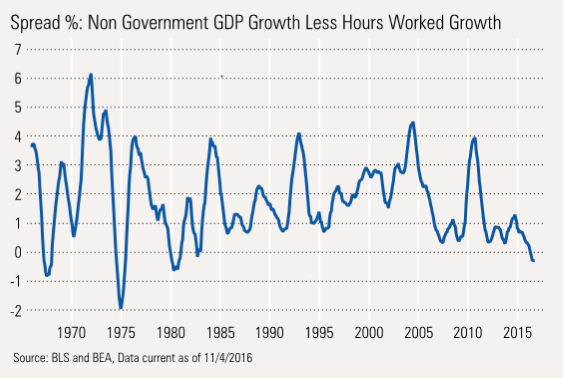
That is not true currently, with a negative spread, as shown above. A negative spread, or even a rapidly falling one, suggests the potential for a recession. The good news is that looking at recent data on hours, it now appears that hours growth has slowed below the 12-month GDP growth rate, potentially correcting the precarious position we are in, if it can be sustained. We suspect the rolling 12-month GDP growth number is also nearing a bottom (the rates of GDP growth slowing have already diminished).
So the good news is that we might be able to avoid a recession; the bad news is that job growth will continue to be muted.
Sector Employment Data Shows Some Quality Improvement
Most sectors of the employment market continued on their normal trends. The recent disappointments have been almost entirely due to the retail sector (1,000 jobs lost in October) and the restaurant and hospitality sector (just 10,000 added versus a more typical 40,000). We had suspected that these two sectors might see issues. As
We have taken a fair amount of heat over the years because the job growth has all been in low end, burger flipping type jobs. That may have been true at the beginning of the recession, but over the last year, that has not been the case, with better-paying professional and business services and healthcare leading the way. In fact, the big jump in hourly wages was at least partially a mix shift to higher-paying jobs and not just better pay for the same job. The data to parse this all out comes with a delay, but if the Fed looks at the wage data carefully, the 2.8% rate might not be quite as inflationary as it seems. And the wage stagnation at the beginning of the recession, might not have been quite as low as it seemed at the time.
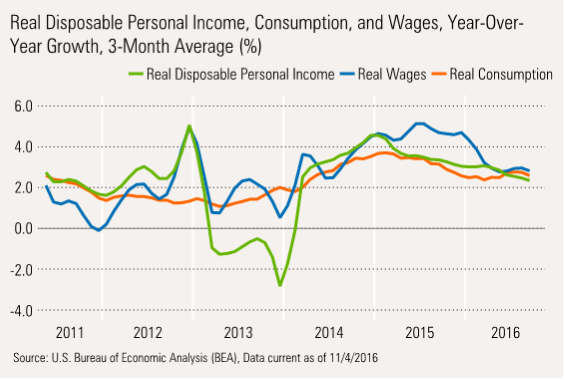
If Wages Drive Consumption, the Economy May Have Issues The income and consumption report for September was released on Oct. 31. The monthly consumption data showed some improvement on a month-to-month basis; however, the August data was revised sharply downward.
With the very low quarterly consumption growth rate released ahead of the monthly data for September, we had feared that something had gone awfully wrong with consumption in September, setting up a very bad pattern. Now with the revised data, the quarter is obviously unchanged, but August was worse than thought and apparently had some rebound in September. But that is about the end of the good news. The year-over-year data showed consumption, wages, and disposable income all trended down. Wage growth had also slowed considerably (just as the BLS labor report did) and is now longer dramatically outpacing consumption.
This report, while very comprehensive and adjusted for inflation, isn't particularly timely. It only goes through September. We already have the BLS Employment Report that suggests inflation-adjusted wage growth will continue to fall, potentially dragging consumption down with it. Weekly retail sales data and the recent auto report also suggest that consumption was under pressure in October.
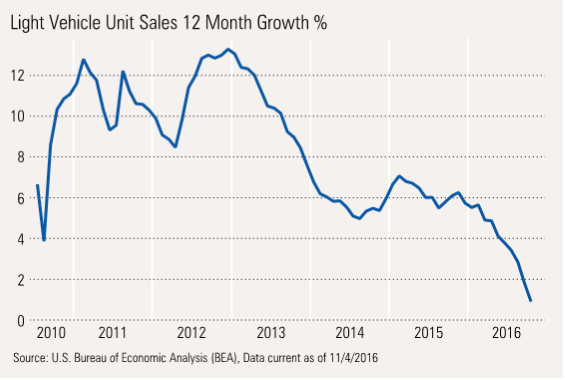
October Auto Sales Not as Bad as Feared; Longer-Term Trends Look Terrible Heavily seasonally adjusted data showed that October unit auto sales came in at 18.0 million units, nearly matching the 18.1 million units of a year ago and the best report of calendar 2016. However, the BEA added a whopping 7% to the raw data reports because of a dubious selling-day adjustment that wrongly assumes that no cars are sold on Sundays. Year over year, the industry is reporting a 6% decline in October units sales, not adjusted for selling days. In the days of the Internet, and many dealerships open Sunday, we have issues with the government's approach.
Nevertheless it's clear that motor vehicle sales continue to slow on a long-term basis and may be a major impediment to consumption growth in the months ahead. With interest rates moving higher, and current selling rates near previous peaks, a quick reversal does not seem to be the most likely case.
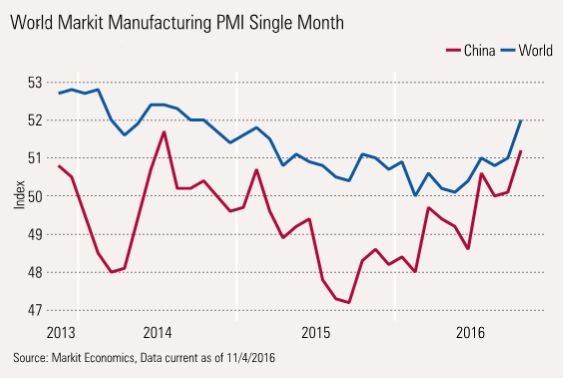
Manufacturing Seems to Be Acting Better, We Are Not So Sure
Interpreting purchasing manager data has become more tricky lately and has clearly become more of a sentiment indicator than being helpful in predicting real-world manufacturing data. That said, the recently released world data, which became available with the Chinese data release this week, are showing improvement. However, the absolute levels of the report are nothing special and are hovering way too close to 50, the demarcation between growth and decline.
/cloudfront-us-east-1.images.arcpublishing.com/morningstar/F2S5UYTO5JG4FOO3S7LPAAIGO4.jpg)
/cloudfront-us-east-1.images.arcpublishing.com/morningstar/7TFN7NDQ5ZHI3PCISRCSC75K5U.png)
/cloudfront-us-east-1.images.arcpublishing.com/morningstar/QFQHXAHS7NCLFPIIBXZZZWXMXA.jpg)