
Profitable Lessons From the Bad Timing of Other Investors
Patience rewards, greed kills.
/s3.amazonaws.com/arc-authors/morningstar/fcc1768d-a037-447d-8b7d-b44a20e0fcf2.jpg)

Fund returns tell us which managers add value, but Morningstar Investor Returns suggest how investors capture or squander that value. Investor returns are dollar-weighted returns that show how well investors timed their fund purchases and sales. With good timing, they may earn better than the official long-term return, but with bad timing, they might lose money even in a solid-performing fund.
We all can take some lessons from examples of funds that investors used well or poorly. (All figures here are for month-end January 2023.) You can find funds’ investor returns in the data pages of mfi.morningstar.com.
Let’s start with Baron Global Advantage BGAFX. Manager Alex Umansky guided the fund to a 10% annualized return over the trailing 10 years ended January 2023. That ranked in the global large-stock growth Morningstar Category’s top quartile. The fund didn’t just earn a steady 10% each year. This is an aggressive fund that really pops when growth stocks are running hot. It posted massive gains of 50% in 2017, 45% in 2019, and 79% in 2020. Amazon.com AMZN and Illumina ILMN were big results boosters.
In 2022′s valuation correction that crushed growth stocks, the fund gave back a big chunk of those gains with a 51.7% loss. Yes, it would have been nice and extremely lucky to have gotten out in 2021, but if you were there for those three big years, you would still be in fine shape. Alas, pretty much no one was. The fund had less than $100 million in assets for its first big year in 2017 and only $100 million before 2019. The fund attracted $200 million in inflows in 2019 and then $1.3 billion as it hit light speed in 2020. In short, most shareholders missed the first two rallies and only participated in part of 2020′s advance.
Flows were flat in 2021, so a few did get out or at least trimmed their positions. Most, however, were there for 2022′s debacle, even though the fund saw modest outflows throughout the year.
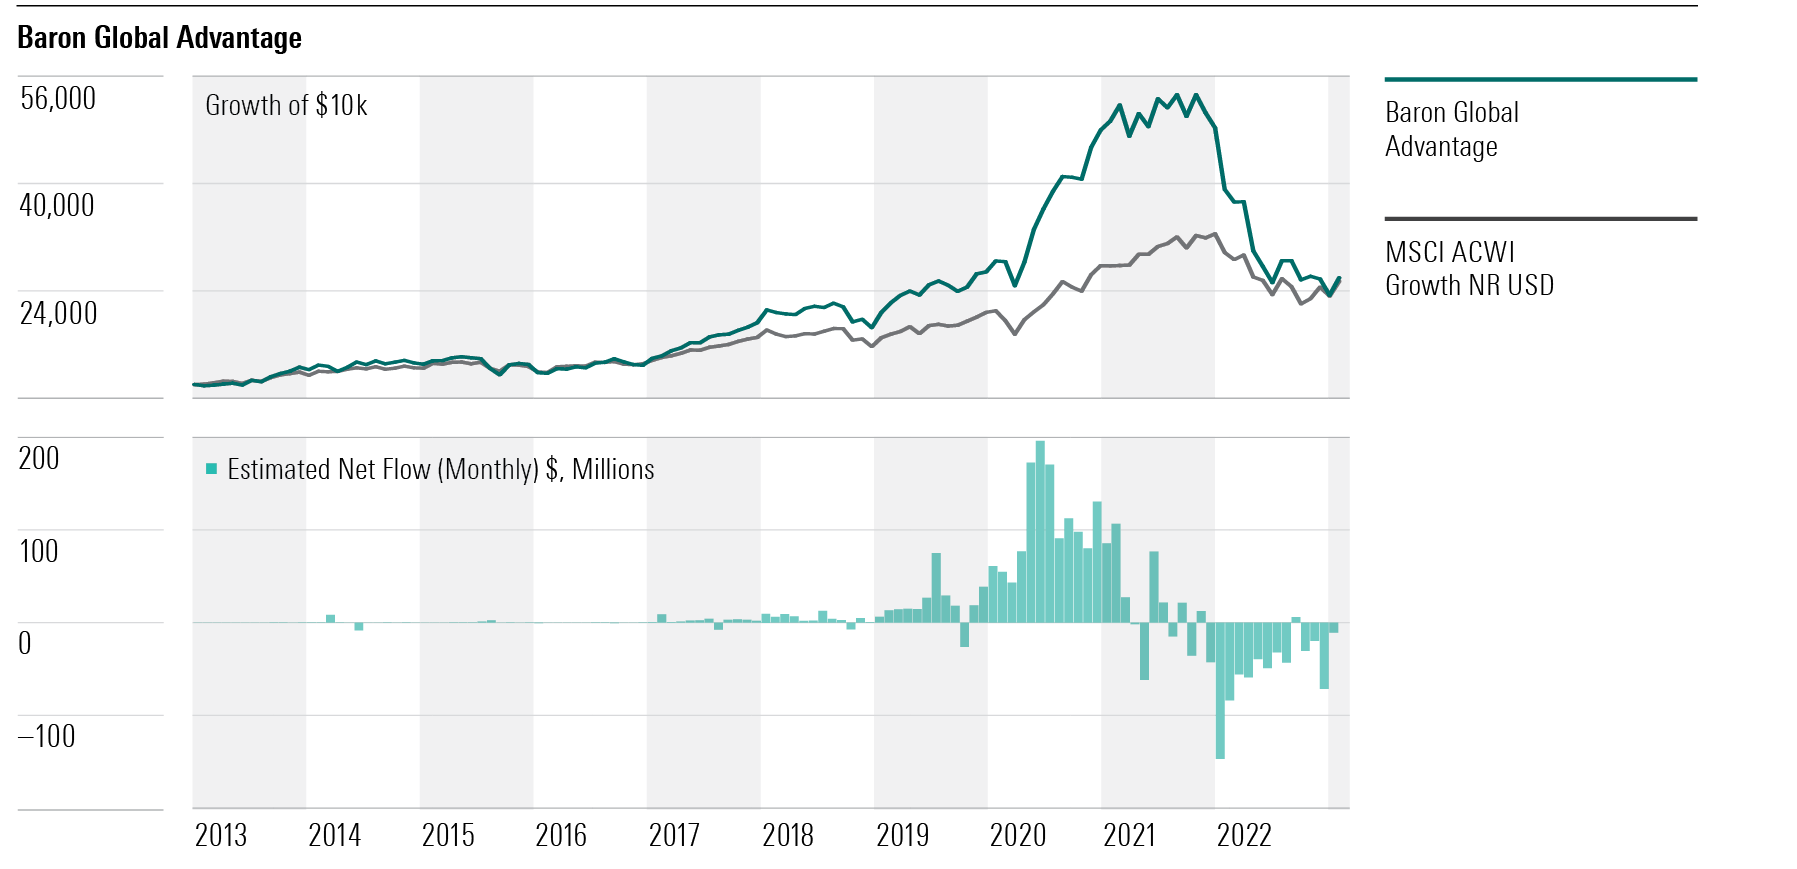
Extreme performance and high Morningstar Risk ratings are hallmarks of funds that are hard for investors to use well. A couple of things would help. First, those big calendar-year returns should tip you off that this is a high-risk/high-reward fund. It makes sense to limit such funds to a small part of your portfolio—ideally less than 5% and definitely no more than 10%. Second, that final blowout year should have been a signal that this fund owned some overheated assets. In 2021, my colleague Jeff Ptak looked at the subsequent results of funds that had posted calendar-year gains of 100% or more since 1990 and found that most lost money over the next three years because they were set up for severe corrections. This fund didn’t hit 100% in a year, but its 45% gain in 2019 and 79% in 2020 put it in a similar space. When funds post extreme gains, proceed with caution.
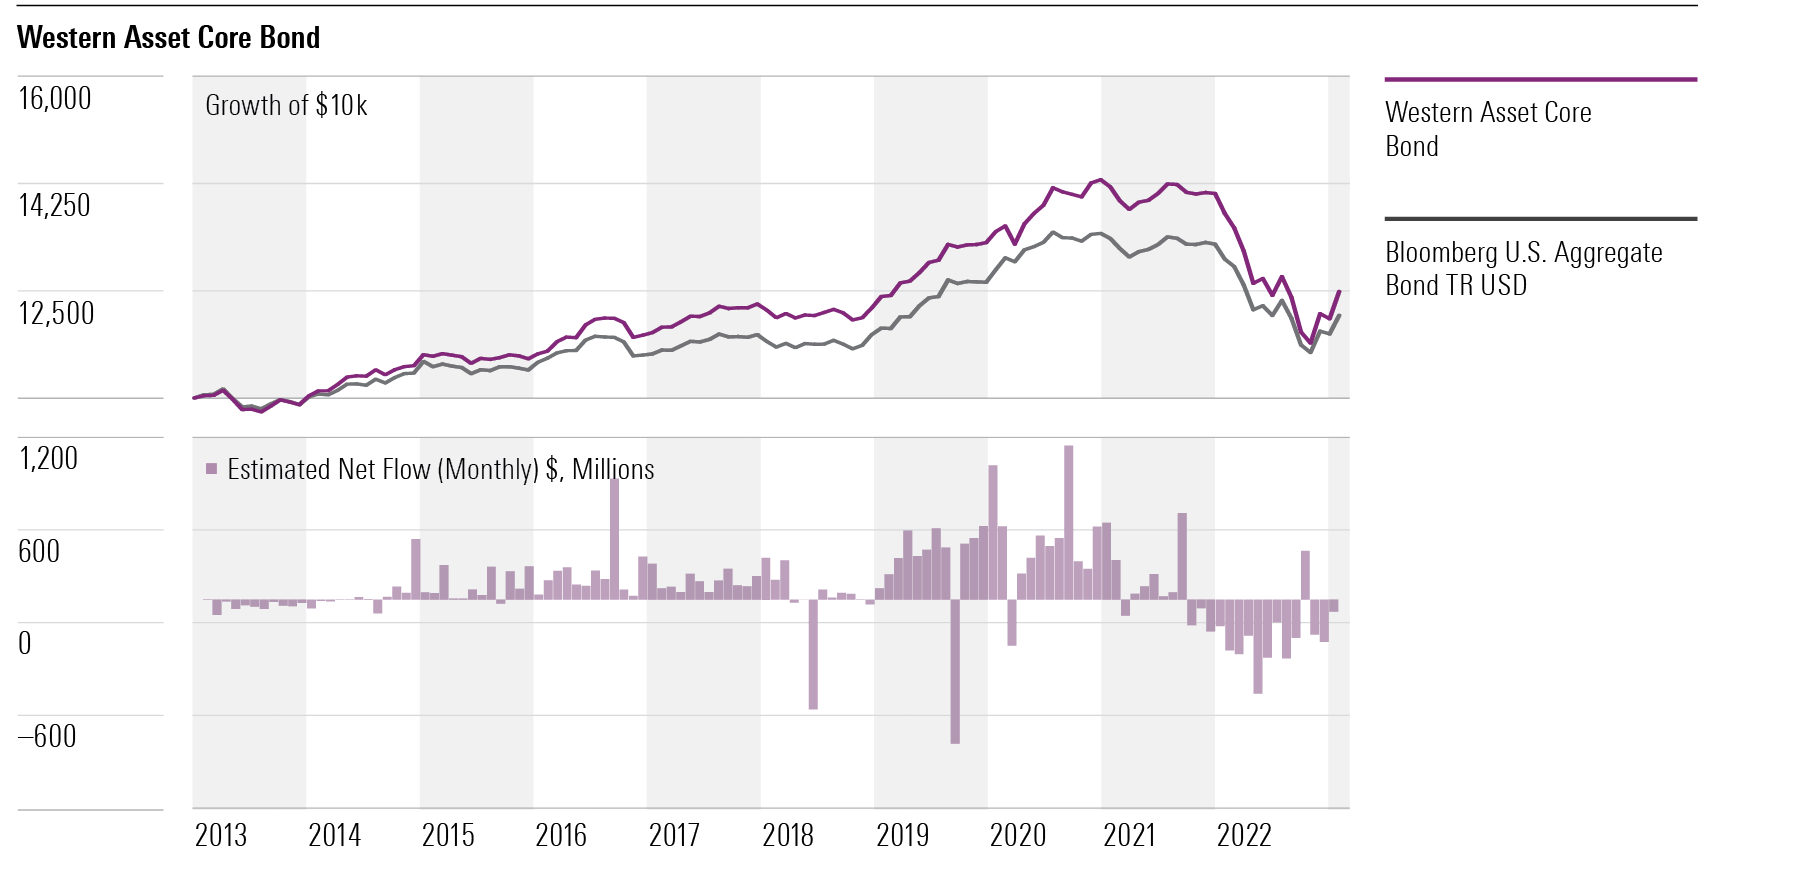
Three bond funds posted top-third 10-year returns but bottom-decile investor returns in the same period. For example, Western Asset Core Bond WATFX gained 1.8% annualized, but the typical investor lost about 1.0%. TIAA-CREF Core Impact Bond TSBIX rose 2.0%, but investors lost about 1.3%. Carillon Reams Core Plus Bond SCPYX increased 1.9% annualized, but investors lost about 0.9%. Bond funds hit a brick wall in 2022 as interest rates spiked, which made bond-fund investors’ decision-making look poor.
All three funds also have mostly institutional shareholders, so you can’t simply blame skittish individual investors.
At Carillon, flows were small except for 2020 when the fund took in $700 million, doubling its size. It then posted losses the next two years. The fund gained 16.0% at its peak in 2020 and lost 12.2% at its 2022 nadir, but its story is just a smaller scale version of Baron Global Advantage’s. Investors bought during the fund’s best year by far.
TIAA-CREF Core Impact Bond gained a modest 7% in 2019—not the sort of blowout that spurs a mad rush. In this case, the fund also had annual inflows of at least $1 billion each year from 2018 through 2021. The fund lost 1% in 2021, but it shed 14% in 2022 and saw $400 million in outflows. So, while there was no blowout year or signs of extreme risk, the fund’s 2022 loss did catch investors off guard.
Western Asset’s aggressive strategy frequently lands the fund in its category’s top or bottom decile. Its managers assume more interest-rate risk than peers, so you can guess what happened. Nice gains of 10.4% in 2019 and 9.1% in 2020 attracted huge inflows, until a 1.8% loss in 2021 and a 16.9% loss in 2022 triggered massive outflows. The fund took in $8.2 billion in 2019 and 2020 combined, but $3.5 billion rushed for the exits in 2022. It shows that institutions and financial planners can also fail to understand a fund’s risks. They should have known the fund’s high-duration figures signaled it would get burned when interest rates spiked, but it looks like many did not take heed.
One clear lesson is that you should know a fund’s risk and stay out if you can’t tolerate the downside. Because bond-fund investors are risk-averse, a 15% loss can trigger sales as extreme as those from a stock fund after a 40% drop. Reaching for a little more yield than most funds offer often includes a big jump in risk.
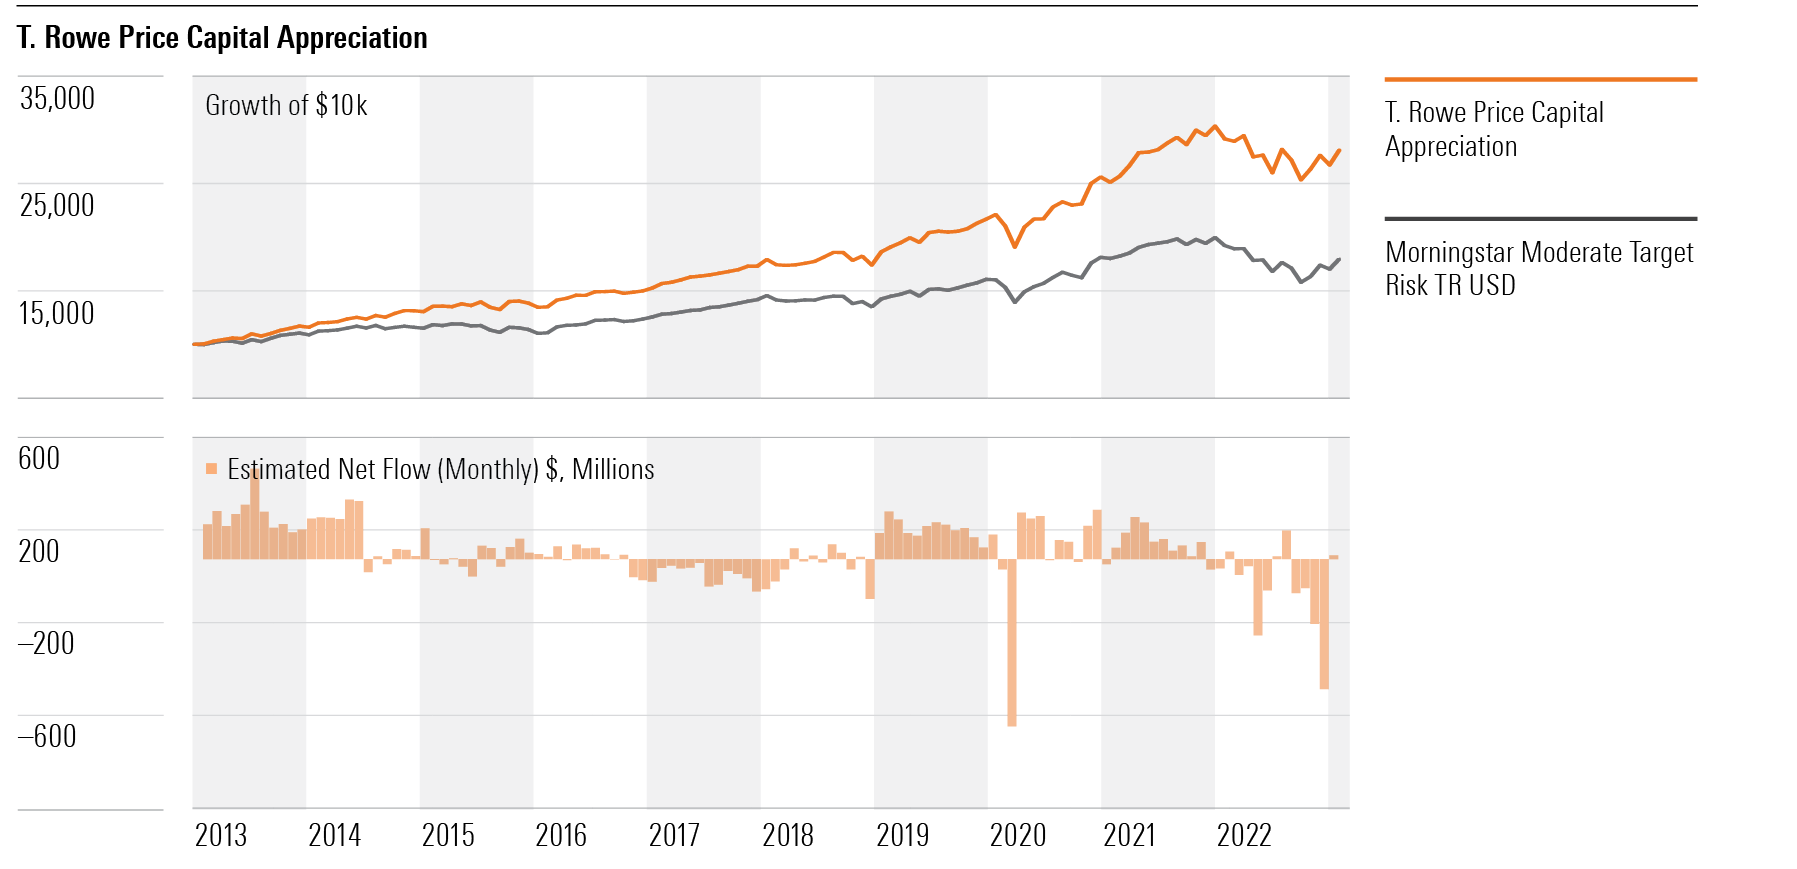
There are success stories. Fidelity Growth Company’s FDGRX 10-year investor return of 17.4% was almost a percentage point better than its 16.7% annualized gain for the period. T. Rowe Price Capital Appreciation PRWCX produced gains of 11.0%, and investors enjoyed 10.3% returns. Those figures are elite. Two common threads: The funds had awesome returns and have been closed to new investors for 16 and eight years, respectively. Picking a great fund and one that will close is a fantastic combination but not the easiest thing to pull off. (Side note, T. Rowe Price is planning to launch an exchange-traded fund that will likely be similar to the equity sleeve of T. Rowe Price Capital Appreciation.)
You can help your investor returns, whether a fund closes or not, by showing restraint. When a fund has a great year, refrain from doubling down. When a fund has a bad year, refrain from bailing unless it has other problems than that one year of performance.
Think about what helps you be patient with a fund. For some, having an investment in a retirement account reminds them it’s a long-term game. For others, having a balanced fund rather than separate stock and bond funds helps because they see a single, muted set of returns rather than two more-variable ones. Also, writing down your reasons for owning a fund can help assess whether to stay or sell and make you less likely to react emotionally.
Jensen Quality Growth JENSX is typical of investor returns success. The fund gained 13.0% annualized and had investor returns of 13.2%. The fund’s emphasis on quality stocks means it usually loses less in downturns but gains less when aggressive growth is all the rage. Funds with lower risk ratings are easier to own. You don’t need to nail the timing the way you do with a fund like Baron Global Advantage. (I own Jensen Quality Growth.)
T. Rowe Price Summit Municipal Intermediate PRSMX gained 2.0%, and investors earned 1.4% annualized, which was top 5% in that category. A sleepy ride likely helped. In the past 10 calendar years, returns have been between positive 7.1% and negative 7.5%. Boring can be pretty effective.
Conclusion
We just had a brutal year for stocks and bonds, so simply looking at a fund’s 2022 loss is a useful exercise when you search for new investments. Risk ratings and standard deviations are a little abstract, but those figures in red ink are not. The better you know your fund’s risk profile and the kinds of markets it’s likely to lose money in, the more likely you are to have a good experience.
This article first appeared in the March 2023 issue of Morningstar FundInvestor. Download a complimentary copy of FundInvestor by visiting this website.
The author or authors own shares in one or more securities mentioned in this article. Find out about Morningstar’s editorial policies.
/cloudfront-us-east-1.images.arcpublishing.com/morningstar/ZKOY2ZAHLJVJJMCLXHIVFME56M.jpg)
/cloudfront-us-east-1.images.arcpublishing.com/morningstar/IGTBIPRO7NEEVJCDNBPNUYEKEY.png)
/cloudfront-us-east-1.images.arcpublishing.com/morningstar/HDPMMDGUA5CUHI254MRUHYEFWU.png)
:quality(80)/s3.amazonaws.com/arc-authors/morningstar/fcc1768d-a037-447d-8b7d-b44a20e0fcf2.jpg)