
How 3 Types of Low-Volatility ETFs Have Fared During Recent Market Turmoil
A closer look at these distinct approaches to low-volatility portfolio construction.
/s3.amazonaws.com/arc-authors/morningstar/ab0b7979-59e4-461f-be92-19c328d94d6f.jpg)
Supercharged by the coronavirus pandemic, supply chain bottlenecks, high inflation, a scorching hot labor market, and aggressive interest-rate hikes, the Morningstar US Market Index—a proxy for the U.S. stock market—logged 30% higher volatility over the last three years than average since January 2007. This backdrop gave rise to interest in low-volatility exchange-traded funds as investors sought shelter from volatile markets.
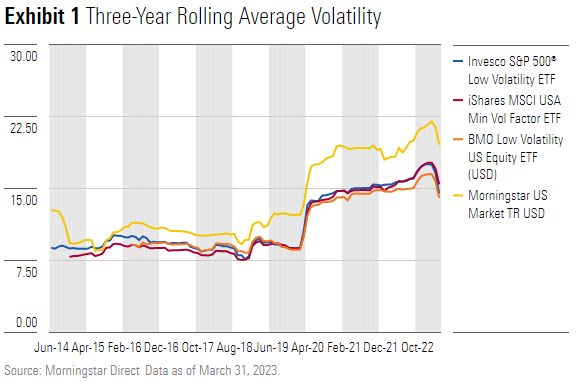
In this article, I will examine three unique ways of constructing low-volatility ETFs and how their construction affected performance over the last three years.
What’s the Low-Volatility Risk Factor?
Stocks exhibiting low return variability have been linked to potential long-term outperformance compared with more volatile ones. These stocks can provide investors with protection during bumpier market environments. Financial theory generally posits that excess returns are driven by extra risk, but the low-volatility factor doesn’t follow such a pattern. Behavioral explanations argue that investors tend to prefer high-risk, high-return investments. As a result, they often overpay for stocks with higher volatility, which makes those stocks more expensive and lowers their expected returns.
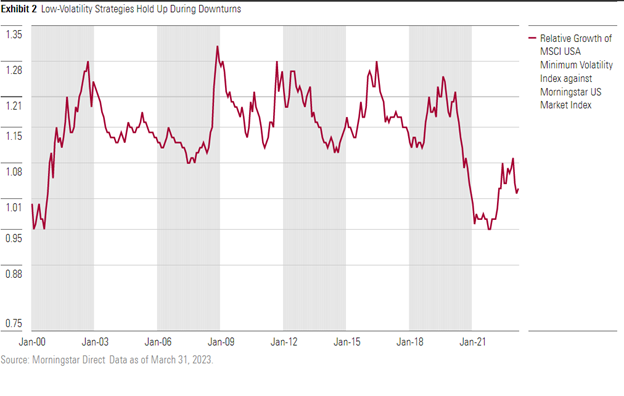
Low-volatility strategies aim to provide investors with protection during market downturns but forgo some of the gains when markets rally. This trade-off can be hard to stomach during long bull markets. However, investors in low-volatility strategies enjoy relative safety when markets eventually contract. These strategies may be a worthwhile ride for those with lower risk tolerance and longer time horizons but may not be ideal for those with riskier appetites. Exhibit 2 plots the relative growth of the MSCI USA Minimum Volatility Index in relation to the Morningstar US Market Index, showing the periods when the MSCI USA Minimum Volatility Index outperformed the overall market.
3 Unique Methods of Constructing Low-Volatility ETFs
Albeit branded similarly, low-volatility ETFs construct their portfolios differently. Strategies are based on one of three metrics: minimum volatility, standard deviation, and beta.
Minimum Volatility
IShares MSCI USA Minimum Volatility Factor ETF USMV, which has a Morningstar Analyst Rating of Silver, aims to minimize portfolio-level volatility by leveraging a propriety equity optimizer that considers stocks’ individual volatility as well as their covariance with other portfolio holdings. It also constrains its stock- and sector allocations to the broader MSCI USA Index from which USMV selects its constituents, which improves its overall diversification. The optimizer is also subject to turnover constraints.
Standard Deviation
Neutral-rated Invesco S&P 500 Low Volatility ETF SPLV mechanically takes the 100 least-volatile S&P 500 index constituents, measured by trailing 12-month standard deviation, and weights them by their volatility. Unlike USMV, SPLV does not implement any constraints and lets its portfolio go wherever it wants.
Beta
Bronze-rated Canada-domiciled BMO Low Volatility US Equity ETF ZLU focuses solely on market sensitivity—also known as beta—and does not explicitly consider a stock’s price volatility. It selects the 100 lowest-beta stocks from the universe of U.S. large-cap stocks and weights them by their trailing five-year beta, with an emphasis on more-recent years. This captures the stocks’ long-term risk profiles and ensures that the fund will not overlook changes that may persist in the short term. ZLU implements stock- and sector-level caps similar to USMV.
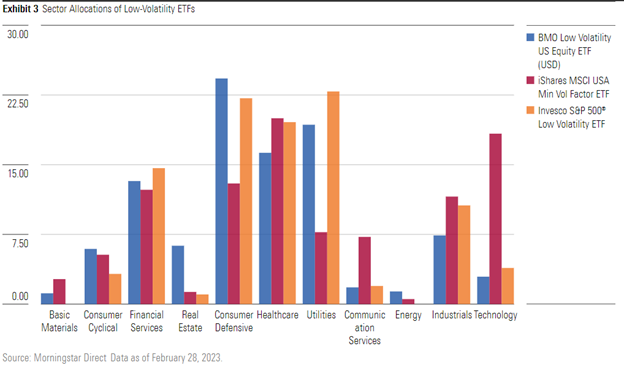
The different construction techniques produce varied portfolios. SPLV and USMV have only 40% of their holdings in common, while ZLU and SPLV share 57% of their holdings. Exhibit 3 illustrates how these different approaches result in meaningfully different sector exposures as of February 2023. For example, SPLV completely misses out on energy stocks and loads on utilities. ZLU, on the other hand, takes a heftier stake in real estate stocks and USMV loads up on technology stocks compared with SPLV and ZLU. These active bets away from the market inform the performance of these ETFs.
How Did These Low-Volatility ETFs Weather the Storm?
Enervated by higher inflation and interest-rate hikes, markets didn’t hold up well in 2022. But these ETFs proved their mettle. ZLU.U—ZLU’s U.S.-dollar-denominated equivalent—SPLV, and USMV held up better than the S&P 500 index on both absolute and risk-adjusted terms in 2022.
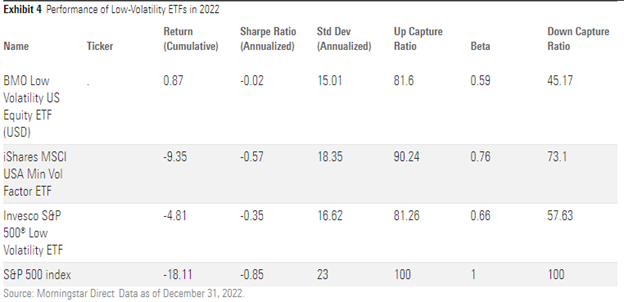
USMV, however, lagged SPLV and ZLU.U by 4.5 and 8.5 percentage points, respectively. SPLV and ZLU.U captured 45% and 57% of the market’s downside, respectively, while USMV captured around 73% of the downside. USMV’s higher stakes in technology and consumer defensive stocks didn’t aid its performance as these stocks suffered in 2022. On the other hand, SPLV’s overweighting of utilities and lighter stakes in technology and consumer cyclical stocks were a winning play in 2022. However, such sector concentrations may not behave similarly in different market environments.
USMV’s constrained approach proved vital during the abrupt COVID-19 drawdown and subsequent recovery. It managed to avoid the sharp shift in stocks’ volatility profile, which led to a steadier journey in 2020. While SPLV had parked around 47% of its assets in real estate and utilities stocks at the end of February 2020, USMV’s more diversified exposure to technology and financial services propped up its portfolio. USMV captured 64% of the upside by the end of 2020, while SPLV managed only 53%.
Similarly, ZLU.U outperformed SPLV by 5.6 percentage points annualized in 2020. ZLU.U’s five-year look-back window smooths out the beta calculation over five years, which makes it unlikely to change its portfolio significantly over the short term. It also implements sector- and stock-level caps, which tames active risk. ZLU.U’s lighter stake in real estate stocks and heavier stakes in consumer defensive and consumer cyclical stocks compared with SPLV buoyed its 2020 returns. Methodology differences should be examined closely as they lead to material differences in each ETF’s risk profile and long-term performance.
USMV’s superior construction should hold up best over the long term. It assesses volatility at the portfolio level rather than security level, resulting in a well-diversified portfolio that wards off unintended sector- or stock-specific risk. While ZLU does not consider portfolio-level market sensitivity, its transparent five-year beta look-back window and sector- and stock-level caps deliver a low-risk portfolio that should offer protection over the long term. For these reasons, USMV and ZLU both receive an Above Average Process Pillar rating and a Morningstar Analyst Rating of Silver and Bronze, respectively. On the other hand, SPLV’s concentrated sector and stock positions lead to higher risk that could compromise its low-volatility mandate, resulting in a Process Pillar rating of Average and a Morningstar Analyst Rating of Neutral.
Do These ETFs Provide Shelter From Volatile Markets?
Despite the catchy name, low-volatility ETFs are still funds that invest in the equity market, which has historically been riskier than other asset classes, like bonds. Investors choosing to invest in such strategies should still expect volatility, albeit less than their starting universes. These ETFs still have a role in an investor’s toolkit, but diversification across and within asset classes can also effectively damp portfolio volatility.
Overall, these strategies deliver on their objective and provide some protection during downturns. But investors need to reassess their understanding of what these funds can and can’t deliver. They can make market downturn less detestable, but there is no hiding from pain in all scenarios.
The author or authors do not own shares in any securities mentioned in this article. Find out about Morningstar’s editorial policies.
/cloudfront-us-east-1.images.arcpublishing.com/morningstar/T2LGZCEHBZBJJPPKHO7Y4EEKSM.png)
/d10o6nnig0wrdw.cloudfront.net/04-18-2024/t_34ccafe52c7c46979f1073e515ef92d4_name_file_960x540_1600_v4_.jpg)
/d10o6nnig0wrdw.cloudfront.net/04-09-2024/t_e87d9a06e6904d6f97765a0784117913_name_file_960x540_1600_v4_.jpg)
:quality(80)/s3.amazonaws.com/arc-authors/morningstar/ab0b7979-59e4-461f-be92-19c328d94d6f.jpg)