
Why Portfolio Diversification Helped Investors in 2022
The approach wasn’t a cure-all during last year’s brutal market environment, but it helped buffer some losses.
/s3.amazonaws.com/arc-authors/morningstar/360a595b-3706-41f3-862d-b9d4d069160e.jpg)

One of the cruel facts about portfolio diversification is that it may or may not pay off in any given period. During periods of market stress, correlations often move higher as many asset classes tend to drop in tandem. And when times are good—such as 2021′s generally bullish environment—a diversified portfolio can lead to lower returns.
In our 2023 Diversification Landscape, we took a deep dive into how different asset classes performed in 2022, how these asset classes’ correlations have changed, and what those changes mean for investors and financial advisors trying to build well-diversified portfolios. We also looked at the diversification benefits of adding various assets to a U.S. equity portfolio, including bonds, international stocks, commodities, alternatives, private investments, and more.
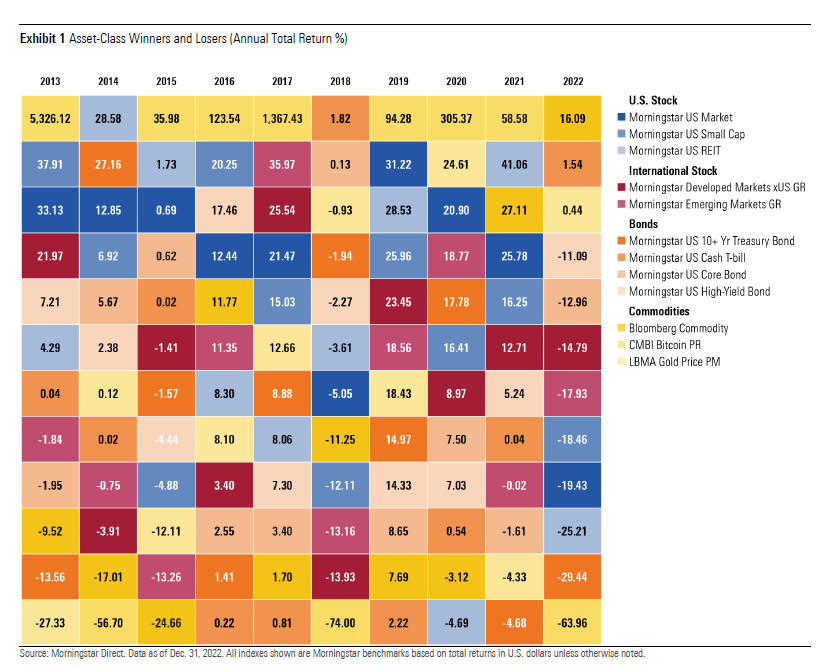
Key Asset-Class Correlations in 2022
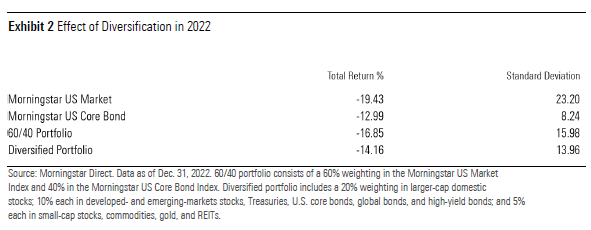
Portfolio diversification wasn’t a panacea during 2022′s brutal market environment, but it did provide some benefits. While the most basic version of a 60/40 portfolio (made up of U.S. stocks and U.S. investment-grade bonds) dropped nearly 17%, a more diversified version held up slightly better, losing about 14% for the year.
To test the value of portfolio diversification, we created a portfolio made up of 11 different asset classes that investors commonly use when building broadly diversified portfolios. We allocated 20% of the portfolio to larger-cap domestic stocks; 10% each to developed- and emerging-markets stocks, Treasuries, U.S. core bonds, global bonds, and high-yield bonds; and 5% each to small-cap stocks, commodities, gold, and REITs.[1]
As shown in the graph below, apart from REITs and long-term Treasuries, every “diversified” asset class fared better than the Morningstar US Market Index, which tracks the performance of the U.S. stock market, in 2022.
And thanks to slightly lower correlations between many of these asset classes, the diversified portfolio would have also done a better job reducing risk than the basic 60/40 portfolio, as shown below.
Last year was the first time in a while that broad portfolio diversification added value. To test the value of diversification over longer historical periods, we used the IA SBBI US Large Stock and IA SBBI US Intermediate Term Government Indexes (which both have longer performance histories) as a baseline for a basic 60/40 portfolio. We used the same 11 asset classes cited earlier to test risk-adjusted returns for a more diversified portfolio along with a stocks-only benchmark and a basic 60/40 portfolio, over rolling 10-year periods starting in 1976.
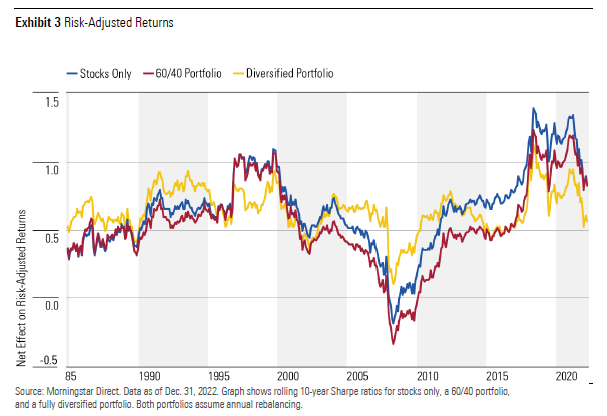
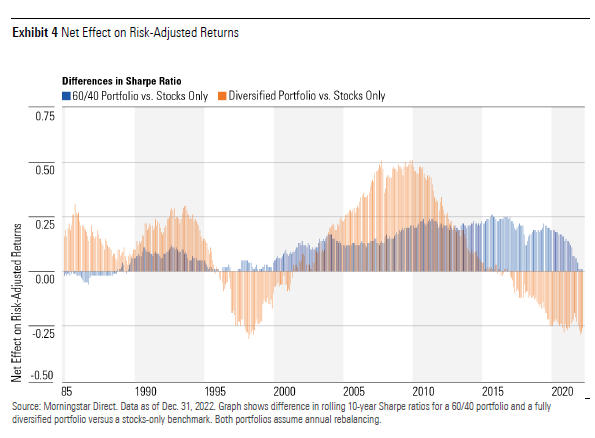
Although portfolio diversification improved risk-adjusted returns (as measured by the Sharpe ratio) versus an all-stock portfolio during most rolling 10-year periods between May 1993 and December 2016, our test portfolio posted weaker risk-adjusted returns over most periods since then. The basic 60/40 portfolio, on the other hand, fared better than the stocks-only benchmark about 88% of the time going back to 1976, and came out ahead of the more broadly diversified version in every rolling 10-year period since the period starting in late 2004.
Diversification’s long period of underperformance mainly reflects the confluence of strong returns for plain-vanilla stocks and bonds and weaker results for international stocks and more specialized assets during most of the period from 2000 through 2021. In addition, market correlations often converge during periods of market crisis, which happened across most major asset classes (with Treasuries and cash the notable exceptions) in early 2020.
Correlations have also trended up over longer periods for some major asset classes, which reduces the value of diversification. Correlations between U.S. and non-U.S. stocks, for example, have significantly increased over the past 10 years. Even areas often touted for their diversification benefits—including REITs and high-yield bonds—have moved in tandem with the broad U.S. equity market more often than investors might expect. In aggregate, the correlation coefficient for the diversified portfolio versus the Morningstar US Market Index rose to 0.96 for the most recent three-year period, compared with 0.87 for the three-year period ended in December 2004.
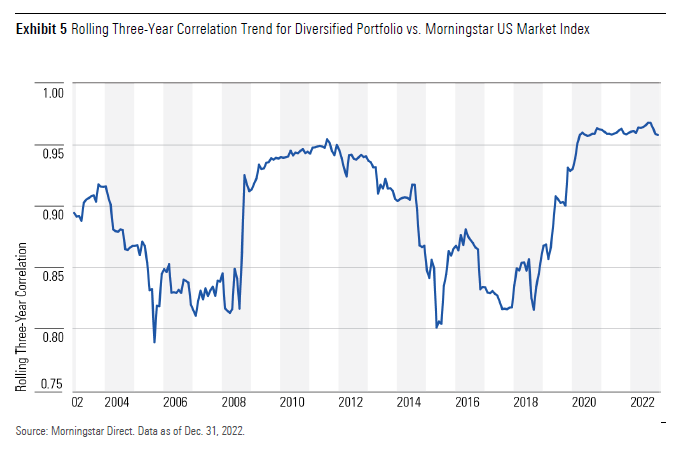
But that doesn’t mean portfolio diversification is fundamentally broken. Although the upward trend in correlations for many asset classes has made it more difficult to build a diversified portfolio, correlations often vary depending on the market environment, as shown in the graph above.
The Outlook for Portfolio Diversification
The key question now: Will diversification continue to add value as it did in 2022, or will a plain-vanilla stock and bond blend once again dominate? The answer depends to a large extent on the macro environment, which went through a significant shift starting in late 2021. In contrast to the low inflation and generally declining interest rates that defined most of the previous three decades, both inflation and interest rates have reversed course. As a result, correlations between stocks and bonds have flipped from negative to positive, reducing the benefit of basic portfolio diversification. How long will this regime last and what will follow?
As we discuss in more detail in the full paper, stock/bond correlations would probably remain positive during an extended period of rising interest rates and/or rising inflation. A rising interest rate and/or rising inflation environment would provide headwinds for the basic 60/40 portfolio and a potential tailwind for broader portfolio diversification. Even so, investors looking to build diversified portfolios must choose asset classes and allocation percentages carefully and recognize the challenges of shifting correlations over time.
[1] Our test portfolio is just one of many potential portfolios that could be tested. We focused on the asset classes most commonly used for diversification purposes and assigned the allocations in simple proportions based on our best estimates of how investors commonly use these assets in practice. We assumed annual rebalancing for the sake of simplicity and to align with how everyday investors generally manage their portfolios.
The author or authors do not own shares in any securities mentioned in this article. Find out about Morningstar’s editorial policies.
/cloudfront-us-east-1.images.arcpublishing.com/morningstar/LUIUEVKYO2PKAIBSSAUSBVZXHI.png)
/cloudfront-us-east-1.images.arcpublishing.com/morningstar/HCVXKY35QNVZ4AHAWI2N4JWONA.png)
:quality(80)/s3.amazonaws.com/arc-authors/morningstar/360a595b-3706-41f3-862d-b9d4d069160e.jpg)