
3 Warning Signs From the Bond Market
Key indicators suggest investors take a more cautious approach.
/s3.amazonaws.com/arc-authors/morningstar/ed88495a-f0ba-4a6a-9a05-52796711ffb1.jpg)
Investors beware: The bond market is flashing red about what’s ahead for the economy and financial markets.
In the weeks since the collapse of Silicon Valley Bank SIVB, there’s been a change in dynamics in the bond market. The outlook has shifted from a focus on high inflation to one of expected, significant strains on the economy. Highly sensitive to shifts in the economy, bonds and the yields attached to them often send signals that presage key turning points in the business cycle.
That contrasts with the stock market, where despite big declines in regional bank stocks, equities are largely in the same zone as they were before the emergence of banking system fears.
Right now, key indicators in the bond market are suggesting investors take a much more cautious stance toward the economy:
- Recession in the cards with short-term yields well above long-term yields.
- Rising credit stress, seen in wide gap between high-yield bonds and Treasuries.
- A weak economy leading to Federal Reserve rate cuts, as short-term Treasury yields plunge.
“The bond market is focused on Federal Reserve behavior and macroeconomic factors,” says Ricky Williamson, senior portfolio manager, head of investments, mutual funds at Morningstar. “It’s more in tune with the economic environment we’re in than the stock market.”
Why Does the Bond Market Matter?
Cast as the sleepy, boring backwater of the capital markets, the bond market doesn’t always get the attention it deserves. It is dull by design. Most investors are drawn to the bond market—which includes government Treasuries; federal agency, corporate, and municipal bonds; and other securities backed by mortgages or credit card or auto loans—for its predictable income and relative stability that helps diversify and balance against the risks in more-volatile stock portfolios.
“Investors don’t tend to pay attention to the bond market,” says Jim Masturzo, chief investment officer of multi-asset strategies at Research Affiliates in Newport Beach, California. “They absolutely should. Just from a size perspective, the global bond market is multiple times larger than the stock market.”
Valued at about $300 trillion, the bond market dwarfs the $124.4 trillion value of the global stock market. The United States accounts for about 40% of the global bond market and about 42% of the global equity market.
The recent banking crisis brought home in a big way the role bonds play in keeping credit flowing throughout the system, supporting companies, governments, and economies. Any kinks in the overall system can lead to a crisis in confidence that exposes other weak links and can quickly threaten to derail the financial system, as we saw in the recent failures of Silicon Valley Bank and Signature Bank SBNY and the forced sale of Credit Suisse CS.
In each case, a high concentration of uninsured depositors rushing to pull out their money led to a catastrophic liquidity crunch as the banks couldn’t meet the demand and exposed lax risk management controls. In the aftermath, jitters spread to other regional banks as well as to bigger European multinationals.
Alarmed about the safety of their deposits, investors sought out the safety of short-term U.S. Treasuries, which led to the steepest decline in the two-year Treasury yield in a three-day period since the stock market crash of 1987. From a high of 5.05% on March 8, the two-year note dropped by more than 1.00% to 3.99% on March 13, a magnitude rarely seen in such a short period in the usually low-volatility bond market. Bond prices rallied as they move inversely to yields.
Recession Warning Signs
One of the most widely watched bond market indicators is the shape of the so-called Treasury yield curve, which is a visual depiction of yields across the maturity spectrum for Treasury bonds. Many tend to focus on the relationship between the two-year and 10-year Treasury yields, also known as the 2s/10s spread.
In a healthy economic environment with stable inflation, the yield curve steepens and gently slopes upward as it progresses from short-term bonds to longer-dated ones. A flattening yield curve tips off investors to changing times and heightening risks as the potential for an inversion becomes a rising possibility.
“The closest thing to a crystal ball in investing is the yield curve,” says Andy Kapyrin, co-chief investment officer at CI RegentAtlantic.
For much of the past year, the bond market has been signaling the potential for a recession as the yields on shorter-dated Treasuries exceeded those of the widely watched 10-year Treasury, a phenomenon known as an inverted yield curve. Shorter-term Treasuries respond more quickly to a rising rate environment and accelerating inflation, their yields rising to reflect the likely negative consequences for the economy.
Recessions have always been preceded by an inverted yield curve, but not all yield-curve inversions lead to recessions. Longer-dated bonds typically have higher yields because investors demand more in return for taking on the added risks of holding the bonds for an extended time. High inflation is one of those risks that could erode the value of a longer-term investment.
In March 2022, the two-year Treasury yield exceeded that of the 10-year Treasury briefly. The 2s/10s inverted again briefly in mid-June.
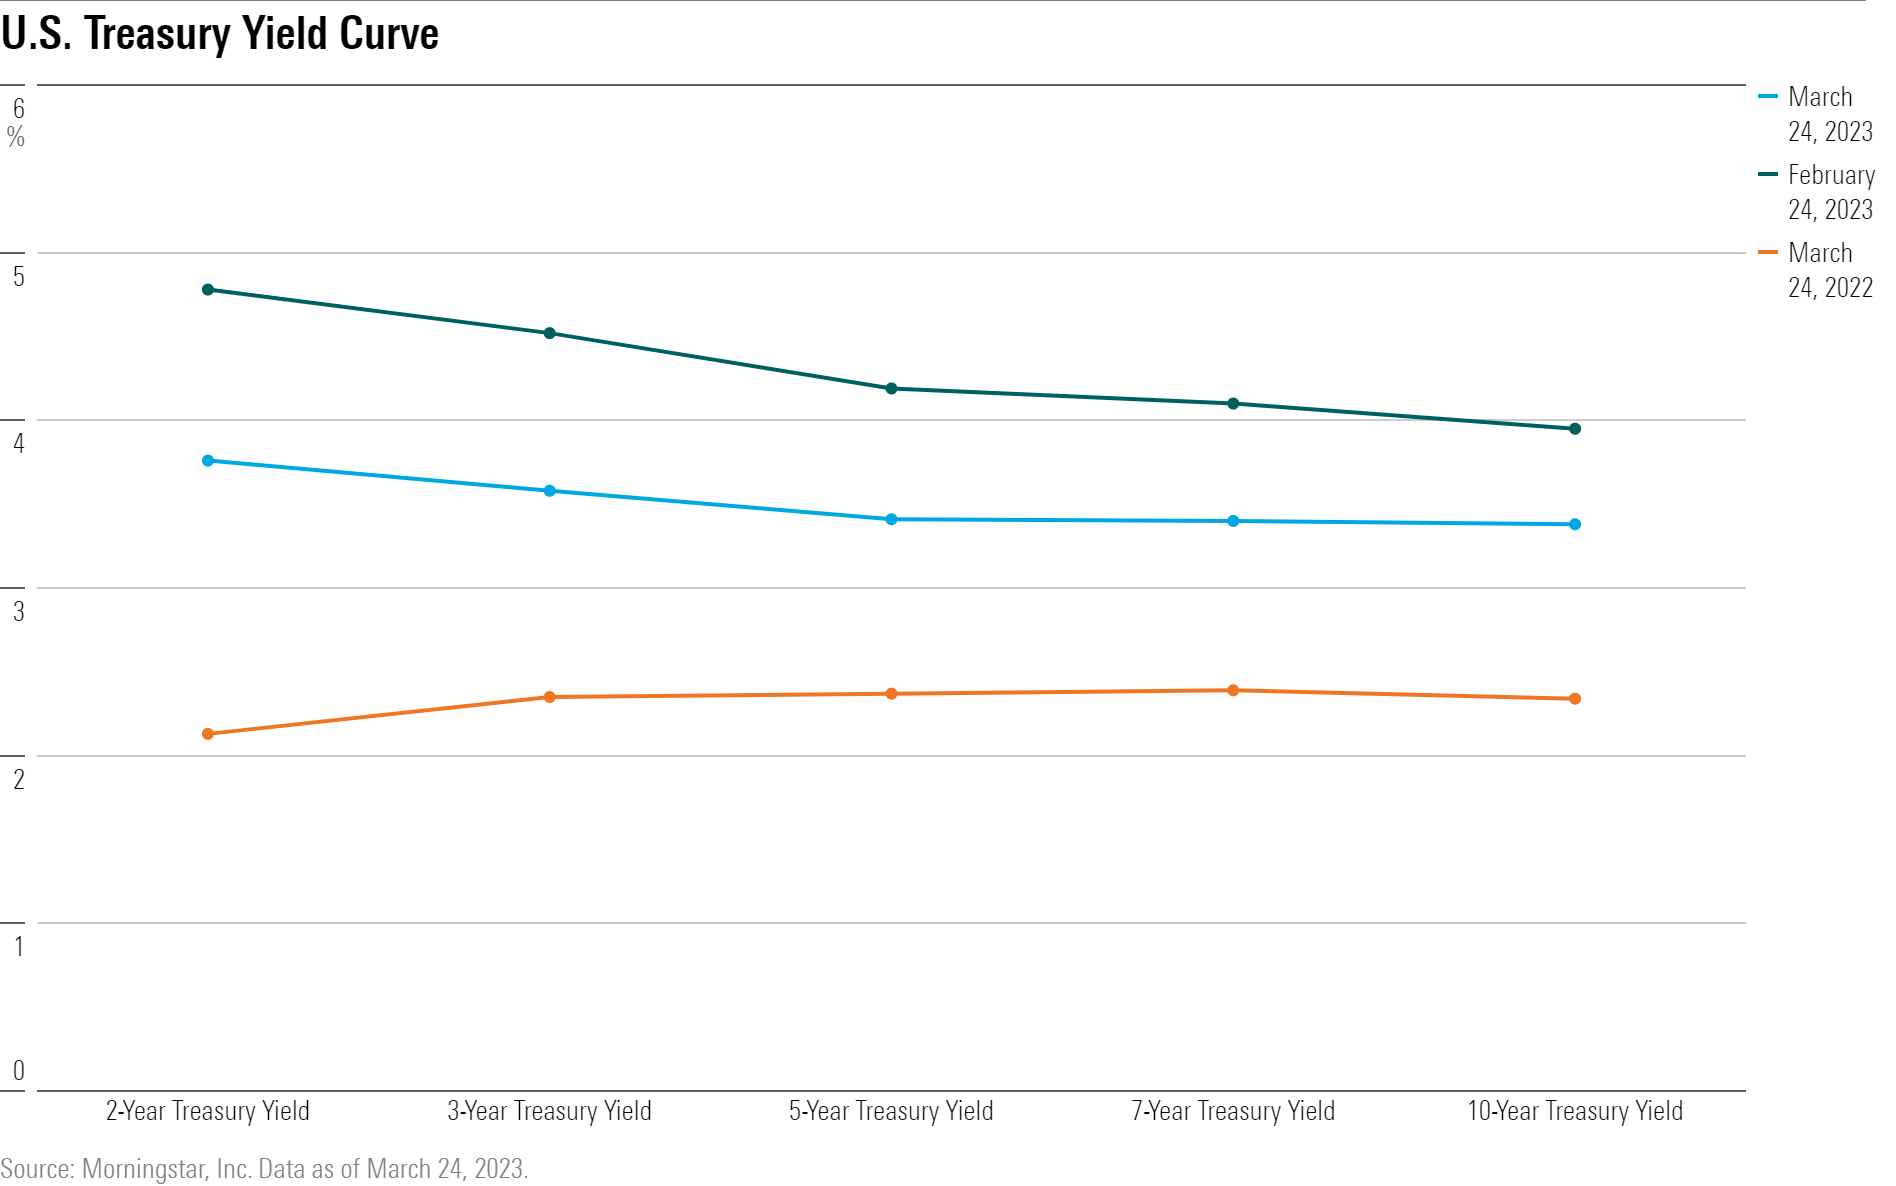
The pair inverted a third time in July and it has stayed inverted since. The 2s/10s inversions receive more focus because there have been more instances of inversions between those two maturities historically, says Masturzo of Research Affiliates. But the greater frequency has also led to more “false positives.”
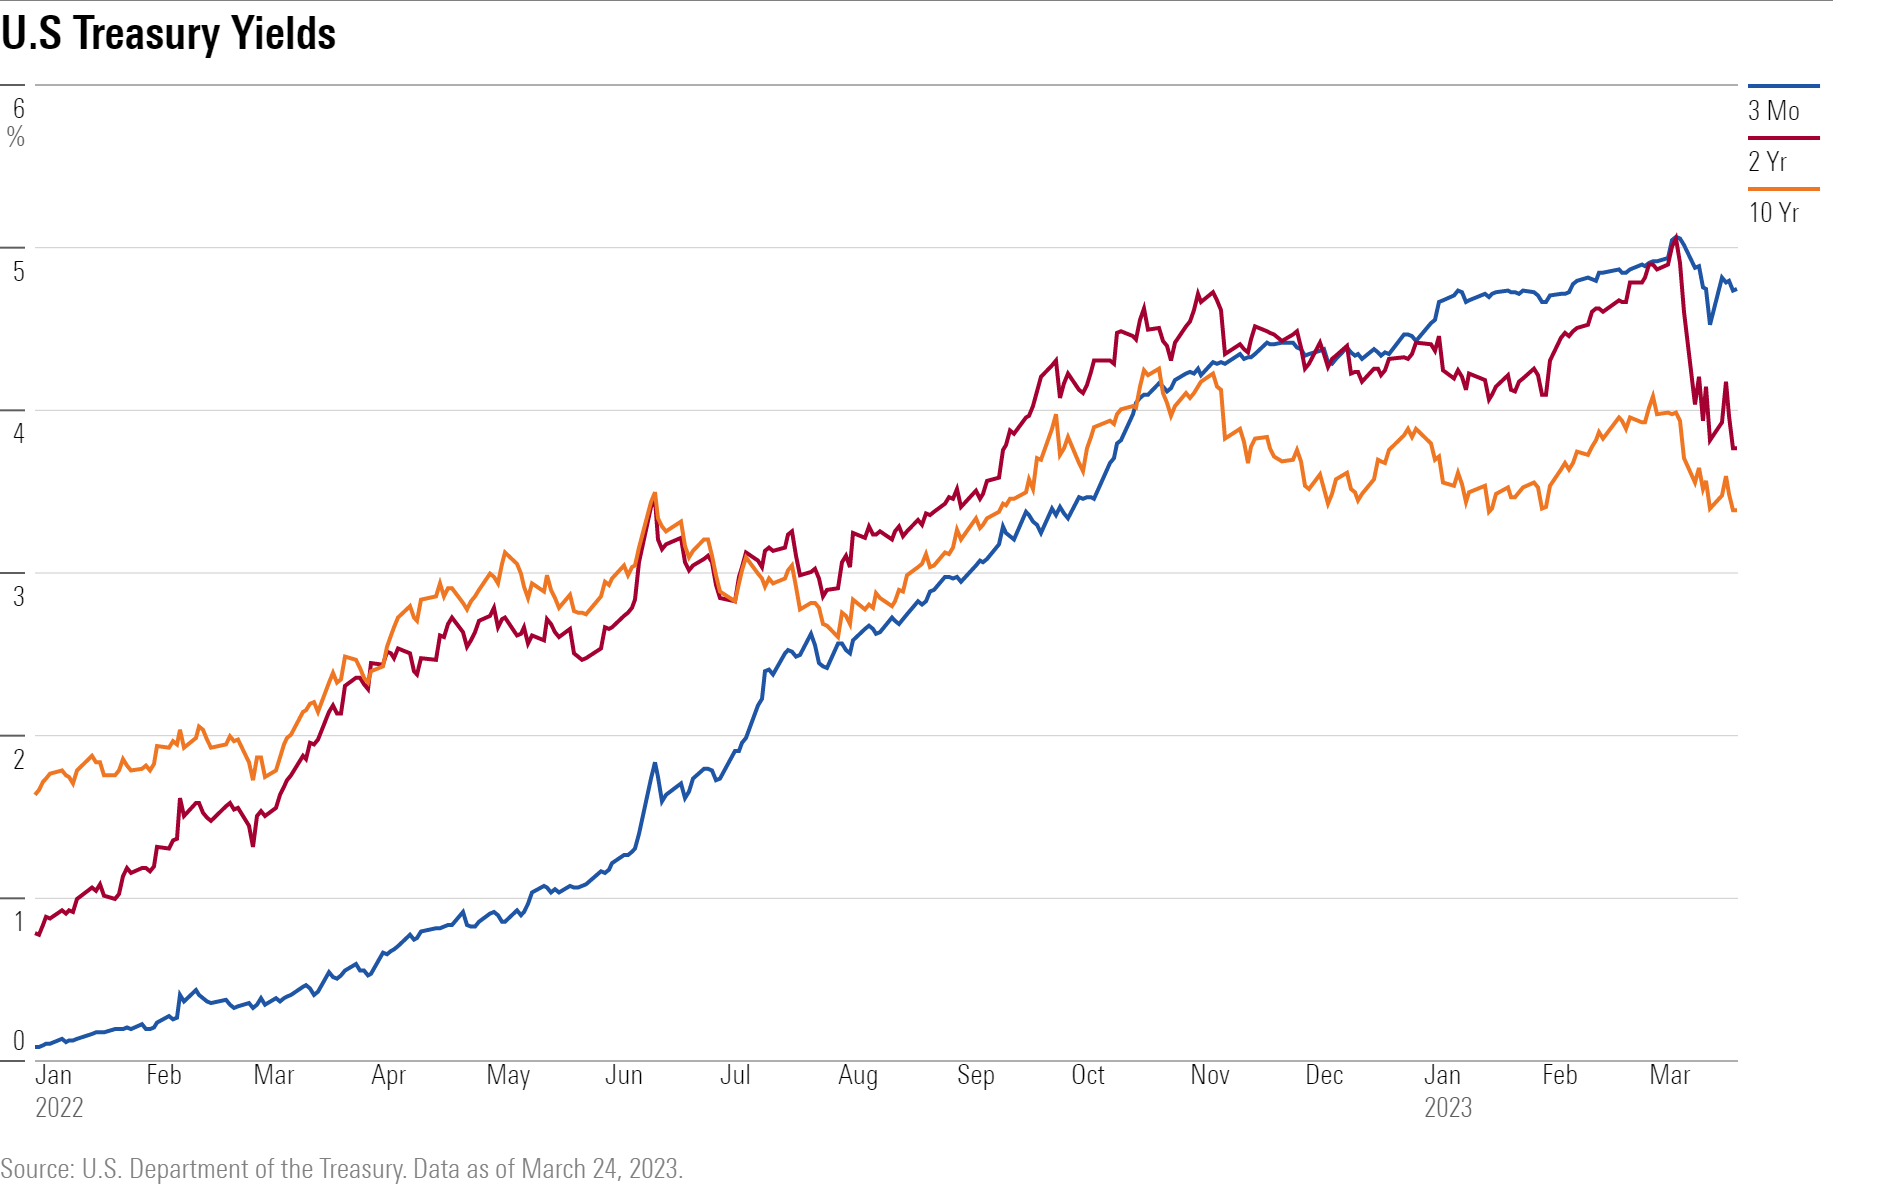
The better gauge of an impending recession, he says, is when the three-month T-bill yields more than the 10-year note.
“It’s been a very nice predictor of recession,” says Masturzo.
Doug Ramsey, chief investment officer at the Leuthold Group, notes that an inversion between 10-year and three-month Treasury yields lasting longer than 10 consecutive days has predicted eight of the past eight recessions.
“No false signals,” he says. “The 10-year/3-month blows the 10s/2s out of the water.”
Since October, the three-month bill has exceeded the 10-year note. Currently, the three-month yields 4.73% and the 10-year 3.51%, the widest gap since 1981.
Corporate Bond Yields Reflecting Rising Risk
Another warning flag is being waved in the corporate bond market.
Borrowing costs for companies, especially those with poorer credit ratings and deemed higher risk, have risen dramatically in just the past few weeks in the aftermath of the banking crisis and the Fed’s latest rate increase, on increased concerns about an economic slowdown.
“The market is saying risk is getting higher, so yields are getting higher,” says Masturzo.
Below-investment-grade bonds, also known as high-yield or “junk” bonds, yielded more than 5% over safer Treasuries late last week, compared with 3.97% on March 6.
“Just a few weeks ago corporate bonds weren’t pricing in a lot of fear,” says Williamson of Morningstar. “That’s quickly shifted and high yield is now more fairly valued.”
Still the credit spread—the difference between the yields on high-yield bonds and Treasuries—remains well below that of March 2020 recession, when it rose to 8.77%, and during the global financial crisis when it reached 19.88% in November 2008.
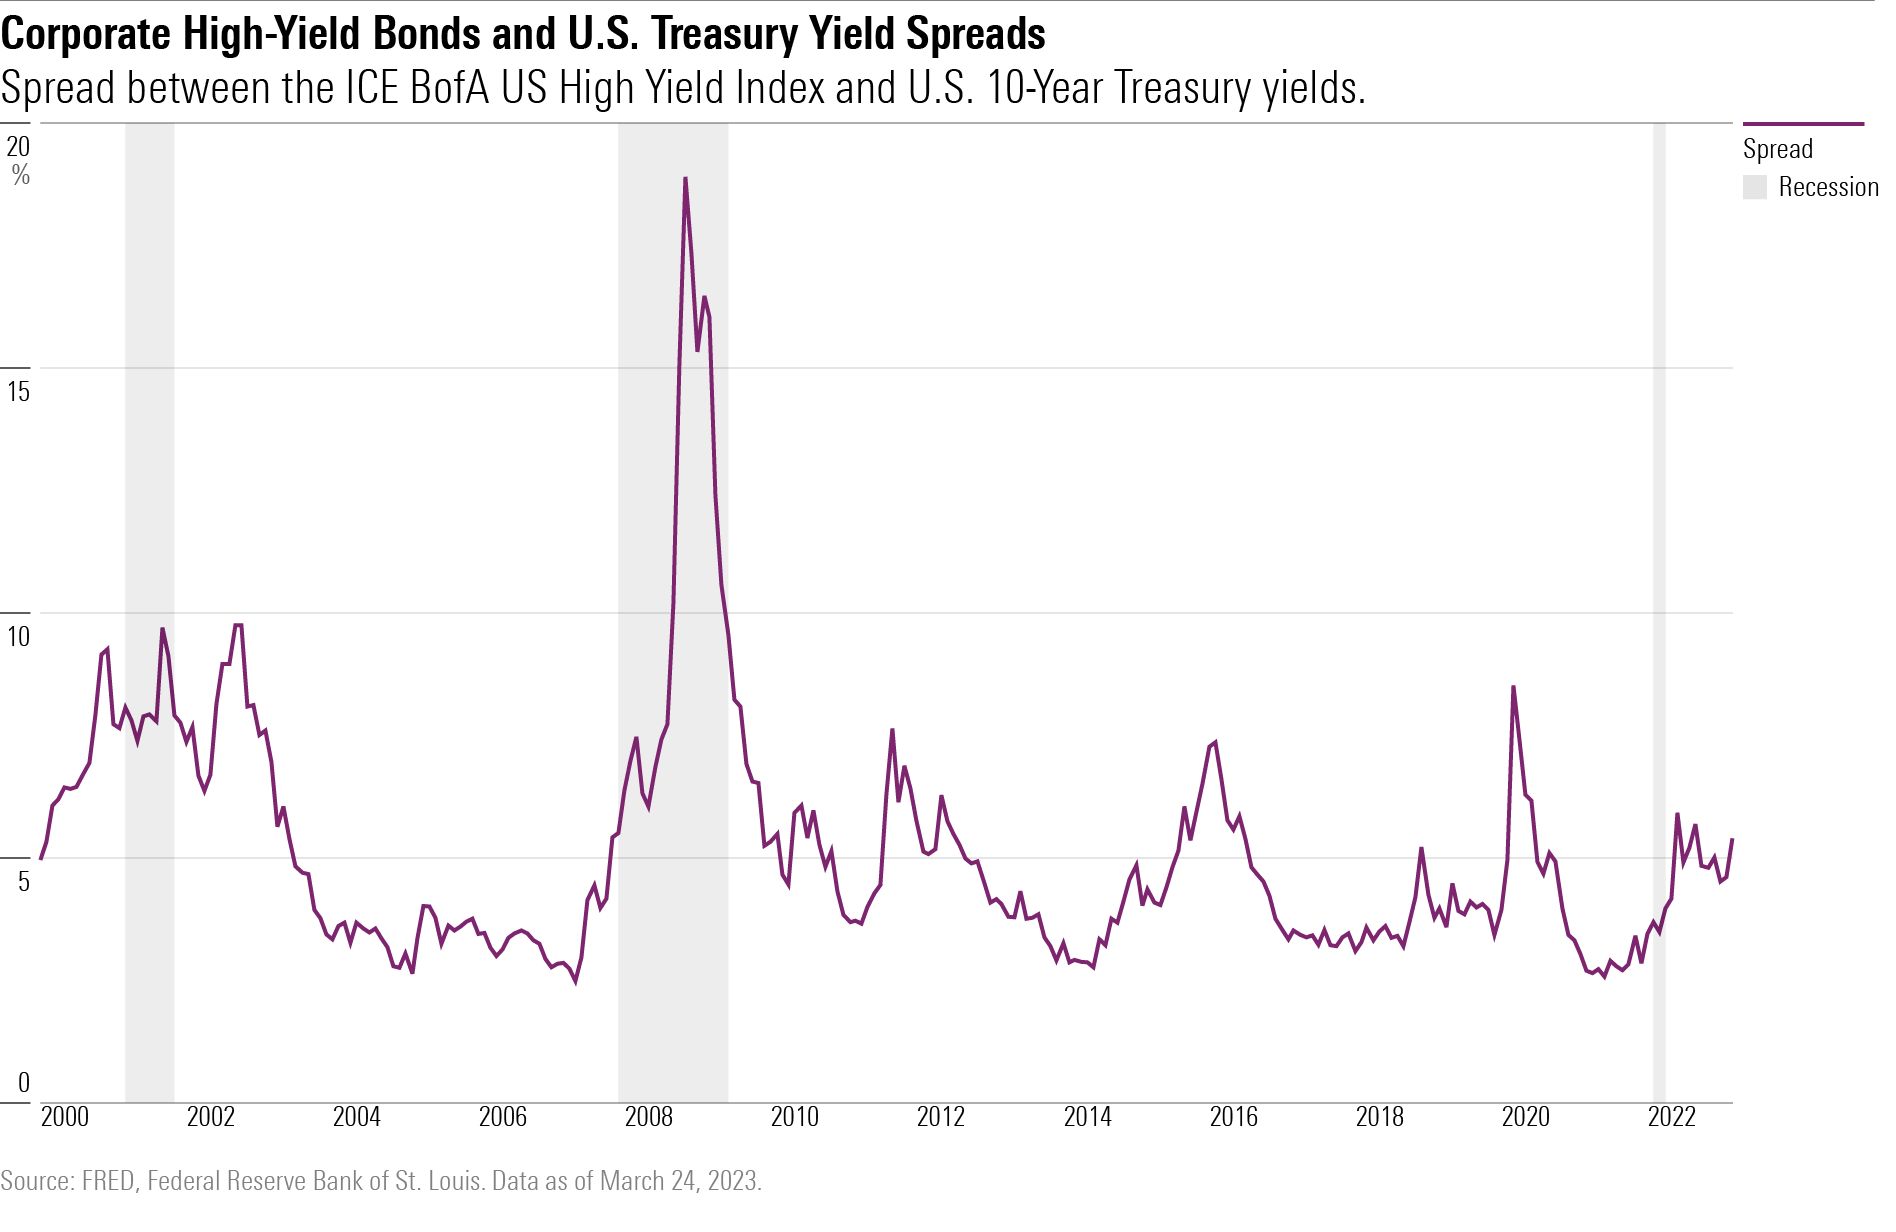
“Credit spreads will widen before credit ratings adjust and before defaults, and are a precursor to further economic distress,” says Williamson.
In early March, investors worried about credit spreads weren’t adequately reflecting the potential risks that corporate bonds carry compared with government bonds and grew cautious, expecting a widening.
Falling Short-Term Treasuries Hint at Rate Cuts to Come
For a third cautionary sign, investors can simply look at the new trend in bond yields: Lower. This marks a significant shift from the past year when bond yields surged on the back of high inflation and the Fed’s interest-rate increases.
Amid the biggest banking crisis in 15 years, investors sought the safe haven of short-term Treasuries and drove the yield on the two-year note down to 3.78% from above 5% on March 8 when Silicon Valley Bank management revealed it was short of capital.
Yields dropped as depositors yanked their money out of low-yielding bank deposits and placed it in higher-yielding and safer money market funds.
Assets under management in money market funds swelled to a record $5.1 trillion last week, attracting $300 billion in the past four weeks, the fastest pace of flows since the pandemic began three years ago.
Bank of America investment strategist Michael Hartnett reminded the firm’s clients in a note last week that the recent surge is reminiscent of the heavy flows that poured into money market funds ahead of the recessions in 2008 and 2020.
The two-year’s sharp and swift decline, something not witnessed since the aftermath of 1987′s stock market crash, is a harbinger of coming rate cuts, market veterans say.
“Capital markets will feel the pain long before the real economy reels from recession,” says Masturzo. “If we go into a recession, the Fed will pull short rates down.”
As yields on short-term bonds come down, the yield curve begins the process of un-inverting and steepening. A steepening yield curve typically suggests optimism about the economy but it also has to be viewed in the context of what stage of the business cycle the economy is in and how it is occurring.
“How it steepens matters,” says Williamson, noting that short-term yields are falling faster than long-term yields are rising. That’s a sign, he says, of heightened concern about the economic environment and often signals rate cuts ahead.
Kapyrin of CI RegentAtlantic notes that “when the two-year bond yields less than the federal-funds rate” the Federal Reserve is about to stop hiking and reverse course.
The fed-funds rate is now 4.75% to 5.00% after the recent 0.25% rate hike.
The author or authors do not own shares in any securities mentioned in this article. Find out about Morningstar’s editorial policies.
/cloudfront-us-east-1.images.arcpublishing.com/morningstar/T5MECJUE65CADONYJ7GARN2A3E.jpeg)
/cloudfront-us-east-1.images.arcpublishing.com/morningstar/VUWQI723Q5E43P5QRTRHGLJ7TI.png)
/d10o6nnig0wrdw.cloudfront.net/04-22-2024/t_ffc6e675543a4913a5312be02f5c571a_name_file_960x540_1600_v4_.jpg)
:quality(80)/s3.amazonaws.com/arc-authors/morningstar/ed88495a-f0ba-4a6a-9a05-52796711ffb1.jpg)